The US Dollar made a lower low on Wednesday as the June CPI continued the disinflationary trend
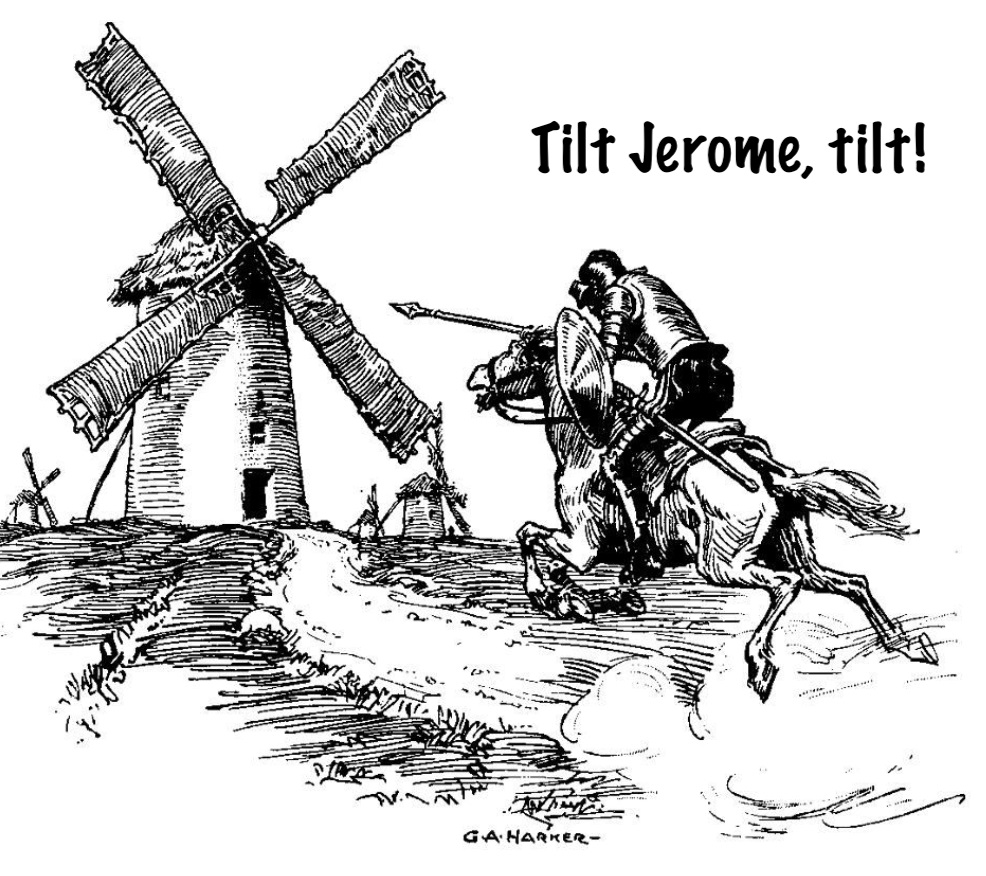
How long will he tilt at the inflationary windmill? A hawkish Fed has been the US dollar’s ally since tardily taking up the fight against the “transitory” inflation over a year ago. The June CPI report was yet another indication that the Fed is tardy once again, going the other way.

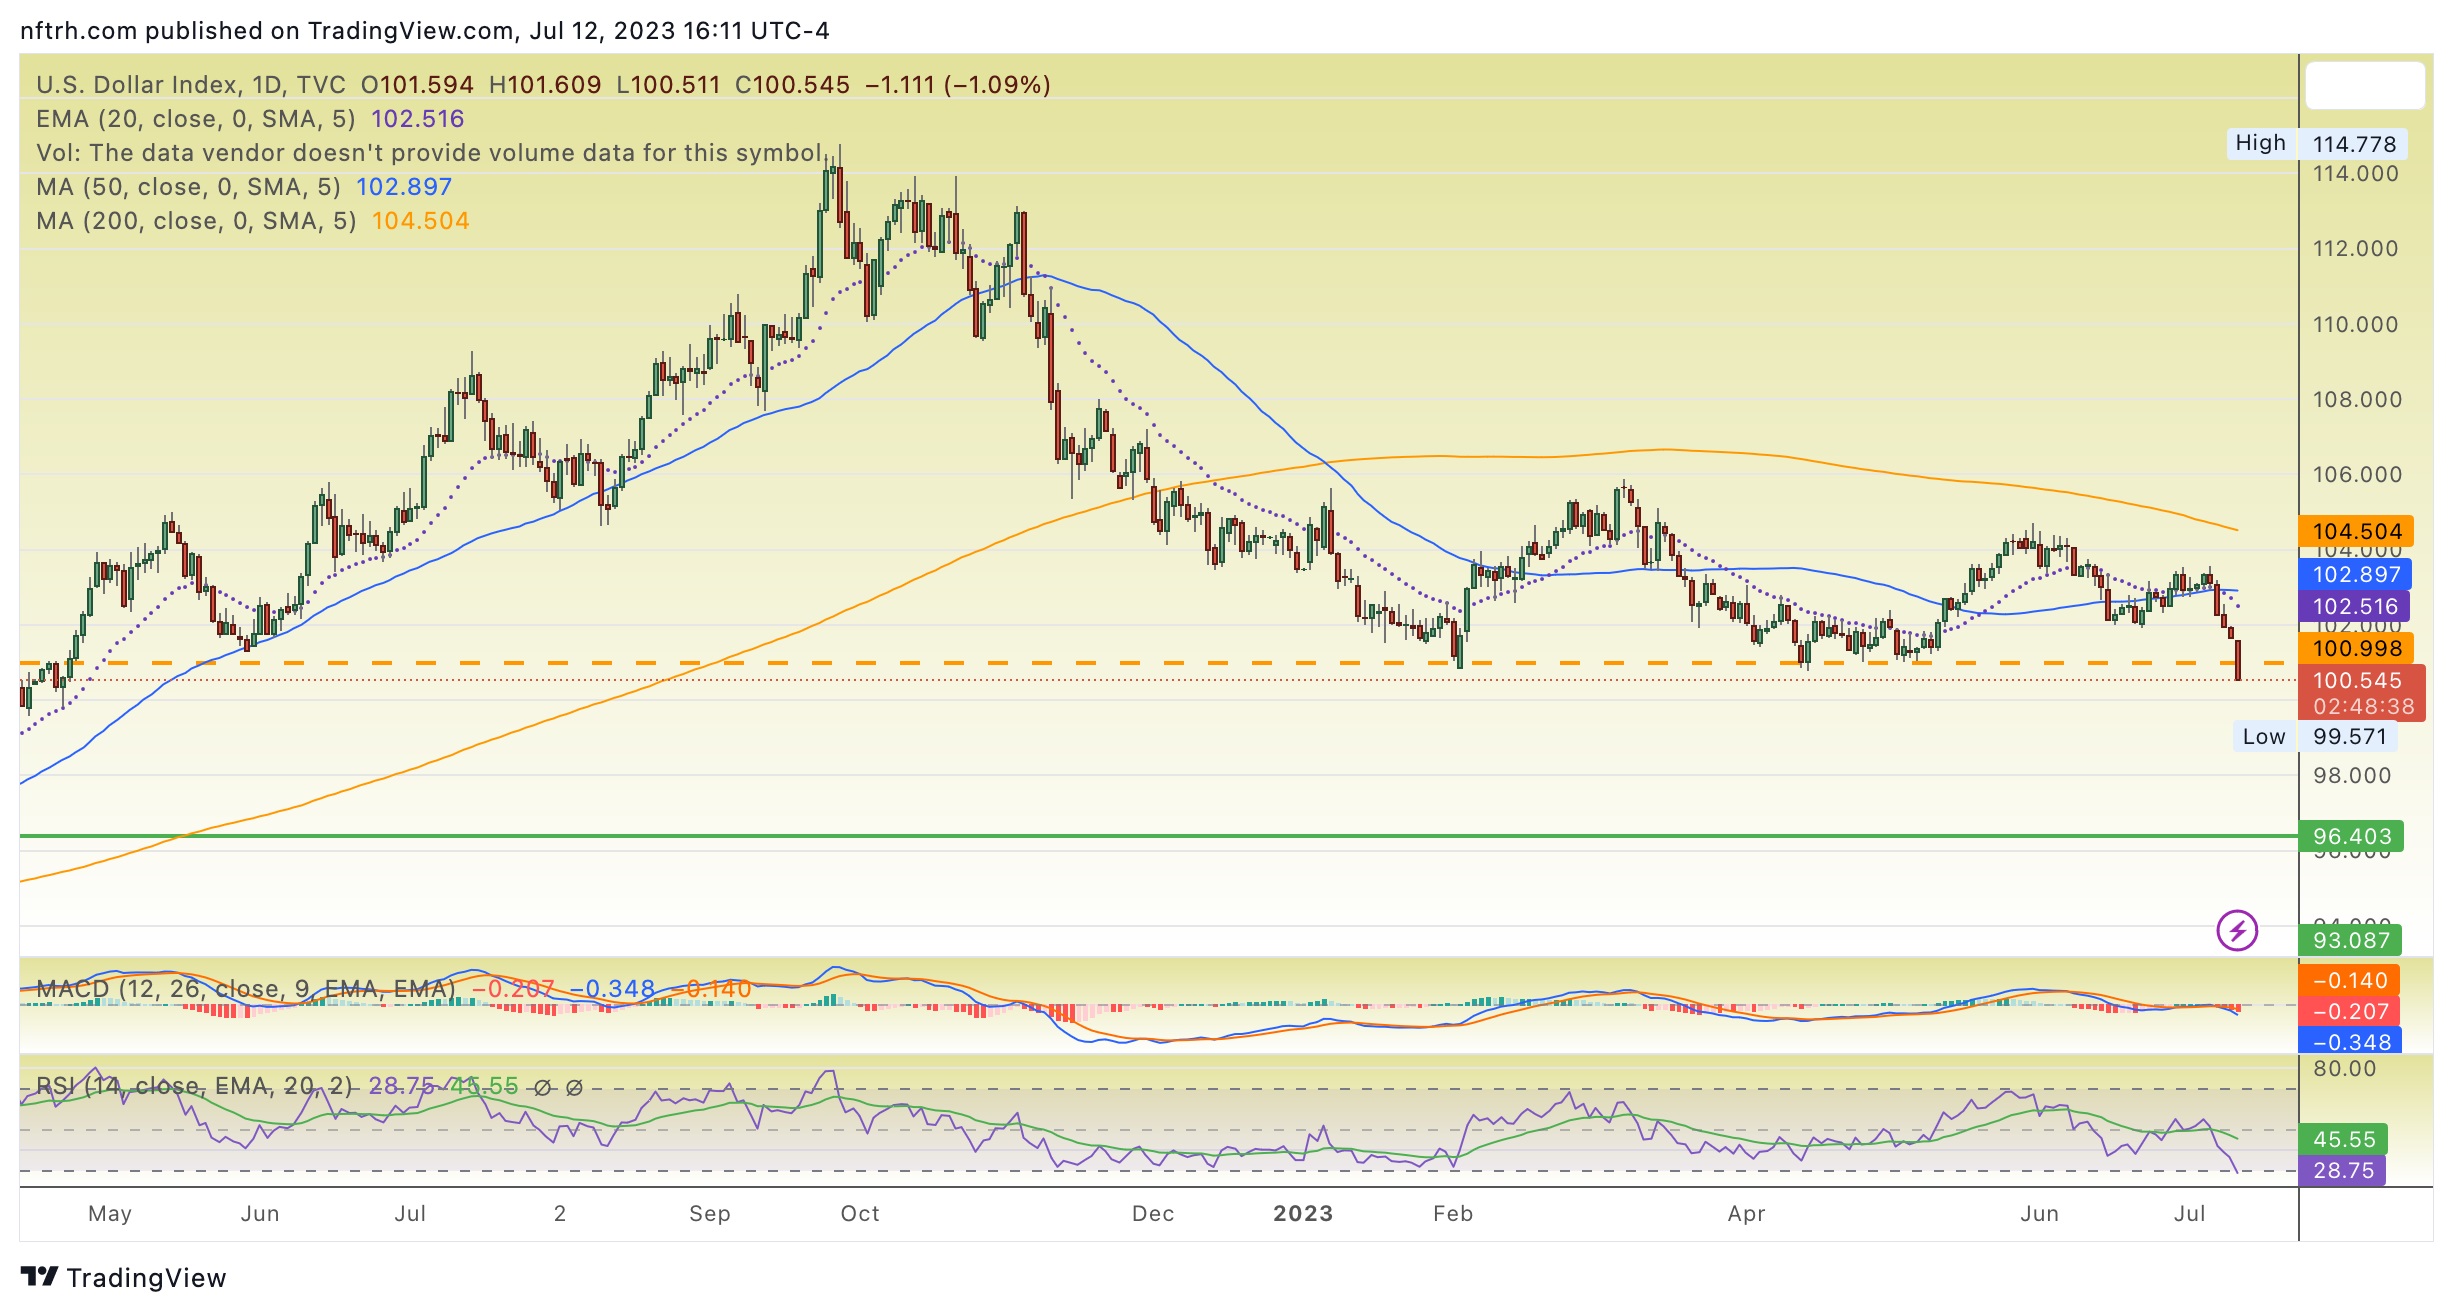
The US dollar has been technically bad for a while now as it has been grappling around the 50 day moving average while the 200 day average, well below which Uncle Buck resides, has turned down. Here is the daily chart of DXY at Wednesday’s US market close, showing the buck cracking key support, for a day at least.
The 101 area – now being violated, pending one or two days’ confirmation – is not just the flimsy support shown on the daily chart. It is the last notable support area prior to potential downside that could reach as far as 93.50, assuming this is not a bear trap/false breakdown. The US Dollar portion of NFTRH 765’s Currencies segment (including global currencies and Bitcoin) explained more.
Other notes pertaining to the below:
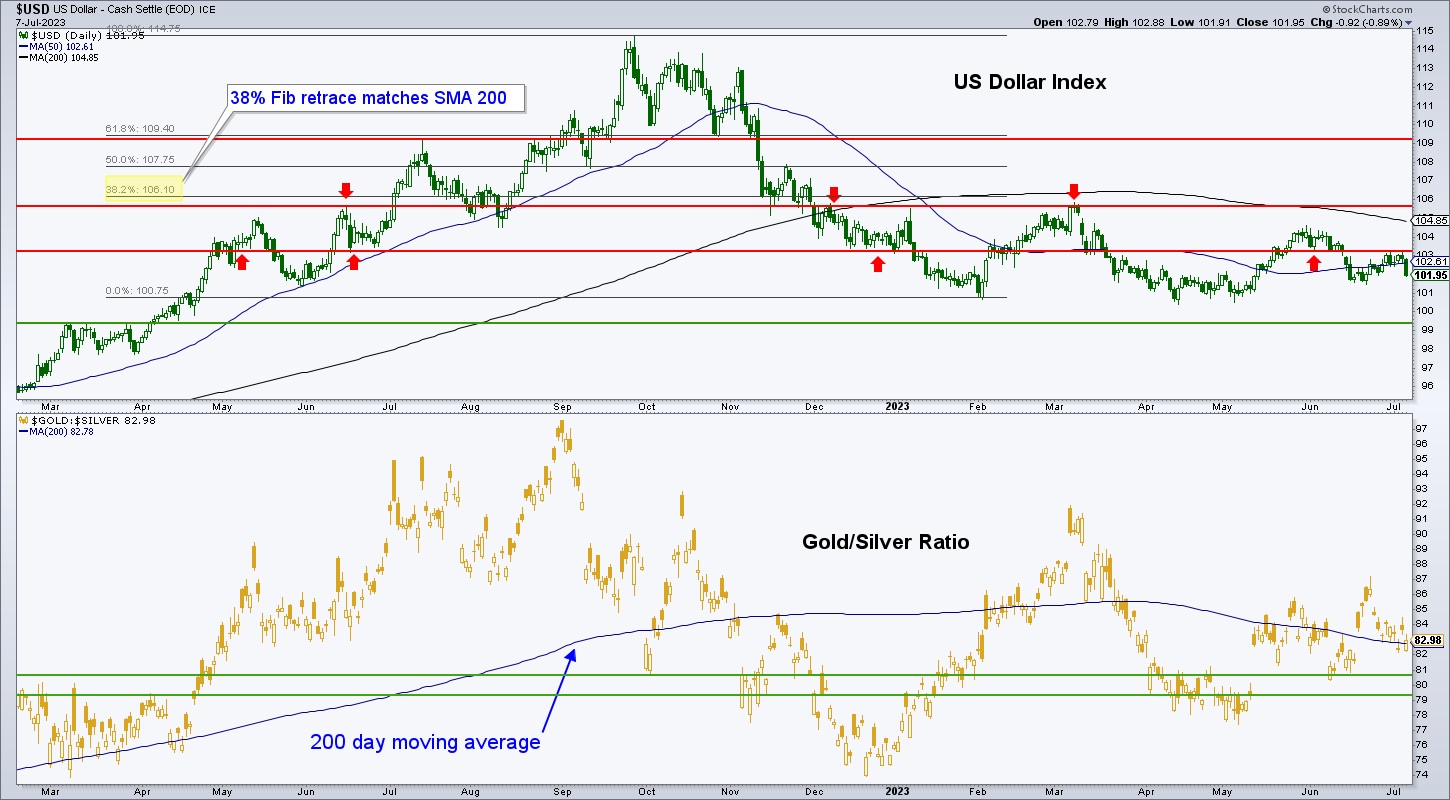
- The Gold/Silver ratio dropped hard along with the US dollar on Wednesday. That is a signal of stable market liquidity, among other things and would run in positive correlation with the inflation trades.
- Our thesis has been that commodities and inflation trades can play catch-up in a rotation from the Goldilocks (Tech/Growth) stuff if the US dollar tanks. But that does not necessarily mean those items would go bearish.
- When we discuss inflation trades, we are not projecting new inflation signaling (yet). The projection is that ‘Fed relief’ and US dollar weakness would lift those boats during easing Fed fears just as they impaired the inflation trades during high inflation and an emboldening hawkish Fed in 2022.
- As noted below, gold stocks, while bullish and now likely to put on a strong rally, are nothing special in this environment. Their best bull market one day will be when the macro falls apart into the mythical “post-bubble contraction” (PBC) for all the reasons stated previously and beyond the scope of this article. As you can probably tell, the macro is anything but post-bubble at this time.
NFTRH 765 Excerpt: US Dollar (July 9, 2023)
USD down, world of assets up on Friday. The buck (daily chart) bonked the first resistance level and fell below the SMA 50. The SMA 200 is sloping down and that is not technically a good thing. The history is a death cross in January and the obligatory hard move in the opposite of its implied direction in February-March. A tick to a lower low, a bounce to a lower high and now here we are. Frankly, the daily chart technicals are not good for USD.
Our thesis has been that despite the poor technicals, a rally can come about at any time if the markets liquidate. The Fed is trying to trigger that, but so far no dice. The market is flipping them and the buck the bird. Gold/Silver ratio (GSR) is a liquidity indicator and like other macro indicators noted above and all along these many months of the rally, it is calm. Recently I have increased my favorability toward inflation trades, and if GSR remains subdued, that prospect can remain in play.
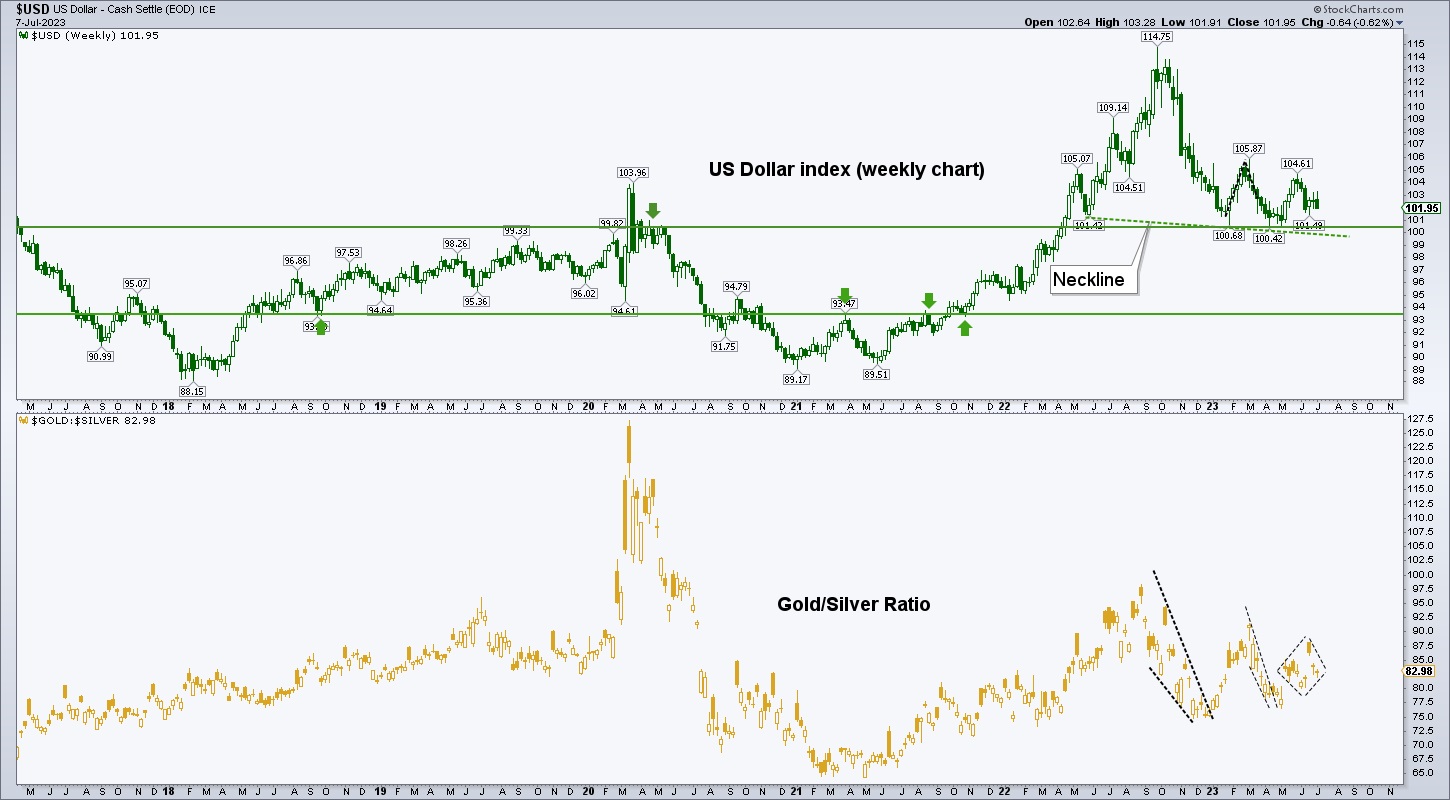
The weekly chart shows how far USD could drop (within its intact bull market) if the support at 100 (+/-) were to be lost. That would-be target is 93.50, which would maintain a series of higher highs/lows from 2008.
Bottom line is that USD’s daily chart technicals do not look good, opening the door for a potential drop to 93.50, which would likely bring a big relief rally to commodities and other inflation trades (precious metals would tag along too, as the ‘death of the dollar’ bugs lather up). But if/when something breaks on the macro, all bets are off and USD would likely gain a classic liquidity bid. Watch GSR and other systemic stress indicators for clues (as yet, they are mostly sedate, with an eye on yield curves).
For “best of breed” top down analysis of all major markets, subscribe to NFTRH Premium, which includes an in-depth weekly market report, detailed market updates and NFTRH+ dynamic updates and chart/trade setup ideas. Subscribe by Credit Card or PayPal using a link on the right sidebar (if using a mobile device you may need to scroll down) or see all options and more info. Keep up to date with actionable public content at NFTRH.com by using the email form on the right sidebar. Follow via Twitter@NFTRHgt.
*********


