Sign up for daily news updates from CleanTechnica on email. Or follow us on Google News!
Data shows leaders and laggards for total electric school buses and combined investments driving electric school bus conversion.
By Danny Katz, Executive Director, CoPIRG Foundation, U.S. PIRG Education Fund
Introduction
Each year, more than 490,000 school buses shuttle children back and forth across the United States –to school, field trips, sporting events and more. As most of these buses burn diesel fuel, children and drivers are exposed to harmful pollutants that are linked to asthma, other health issues and cognitive development problems.
Conversely, electric school buses have zero tailpipe emissions, and therefore offer a cleaner, healthier alternative to diesel buses. This report finds the number of these zero-emission vehicles are growing in school districts around the country, thanks in part to big investments from Congress and states to transition to electric school buses.
Federal Funding
As part of the Bipartisan Infrastructure Law, Congress authorized up to $5 billion to help school districts transition to electric school buses via the Clean School Bus Program (CSBP). The program provides grant and rebate funding opportunities to school districts, nonprofit school transportation associations and tribal organizations to replace older, diesel buses with newer, electric or low-emission models.
The first round of funding applications under the new program solicited applications from May through August 2022, and the EPA received approximately 2,000 applications requesting nearly $4 billion for 12,000 buses. Due to the high demand, the agency nearly doubled its initial $500 million rebate pool. The awards for that round of funding are shown below.
2022 Clean School Bus Rebate Program Awards

In 2023, the EPA opened a second funding opportunity through the 2023 Clean School Bus Grant Program, which provided grants rather than the previous rebate. Winners were selected based on their applications and prioritizing high need and rural school districts.
2023 Clean School Bus Grant Program Awards

In September 2023 a third round of funding opened in the form of a rebate. On May 29th, the EPA announced awards for the 2023 rebates, shown in the table below.
2023 Clean School Bus Rebate Program Awards

The Clean Heavy Duty Vehicles Grant Program
The Inflation Reduction Act sets aside $1 billion to fund the transition to zero-emission heavy duty vehicles including zero-emission Class 6 or Class 7 school buses via the Clean Heavy Duty Vehicles (CHDV) Grant Program. This program was open to other heavy duty electric vehicles in addition to Class 6 and 7 school buses, including dump trucks, transit buses, delivery trucks and others. Applications for grants opened in April 2024, and the application period closed in July 2024. Information about awards for the CHDV program will be posted on the EPA Clean Heavy Duty Vehicle Program website.
The EPA plans to notify grantees in November 2024 and award the grants in February 2025.
State Funding
In addition to the EPA’s monumental investment in the transition to electric school buses, states from across the country have adopted legislation of their own to support school districts in replacing older diesel buses with cleaner electric ones.
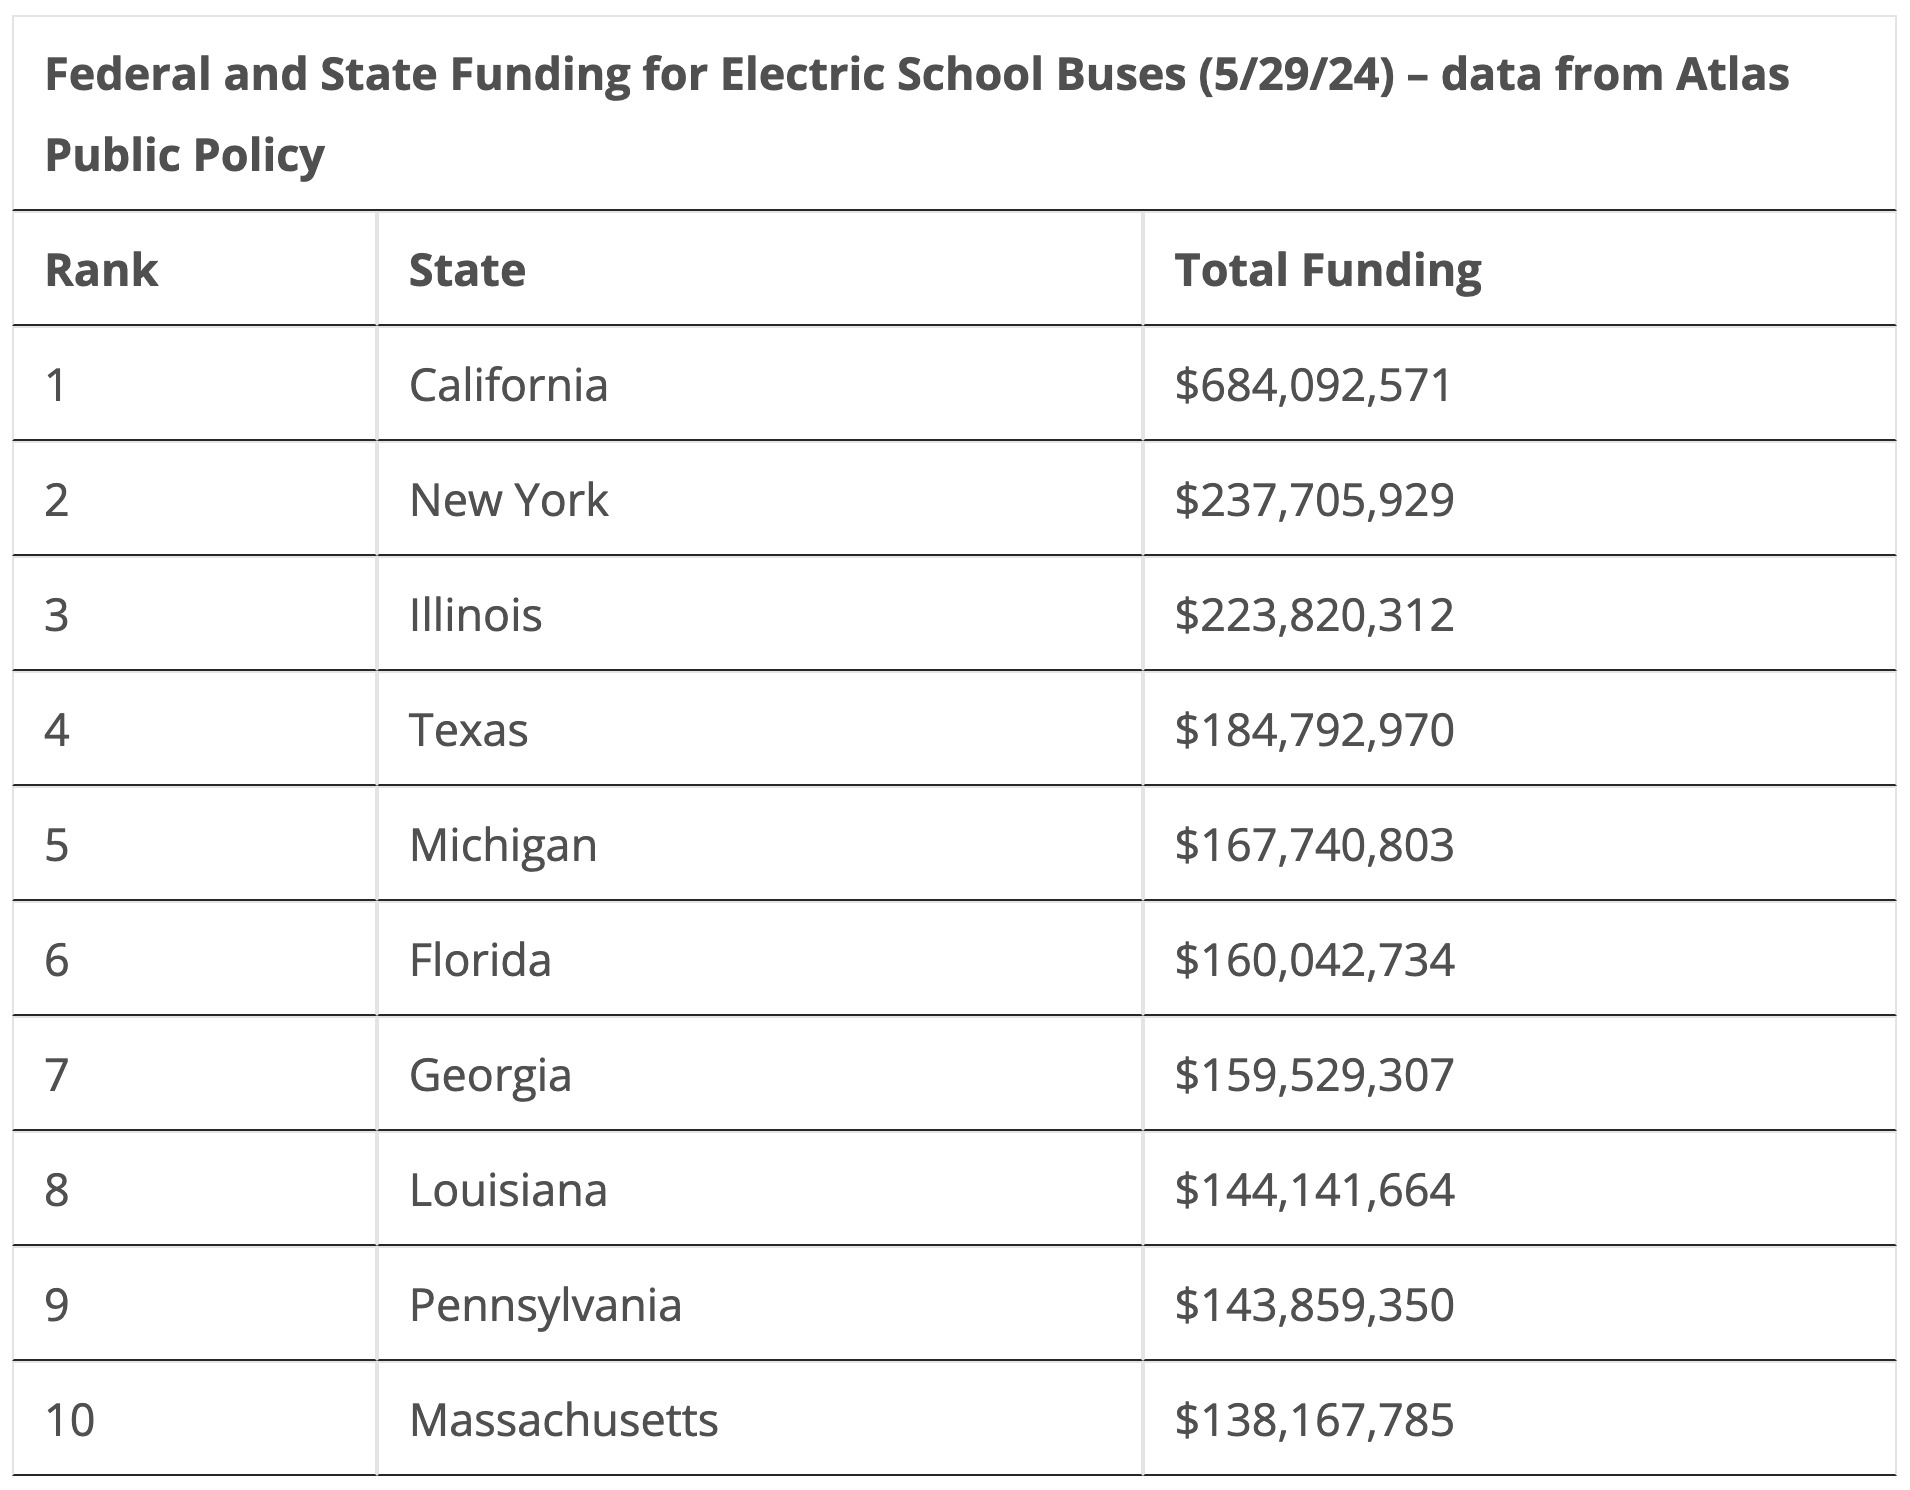
Below is a list of the top 10 states based on the total state and federal funding dedicated to electric school buses as of May 29, 2024.*

A complete list of states ranked by public funding for electric school buses can be found in Appendix A.
Number of electric school buses by state
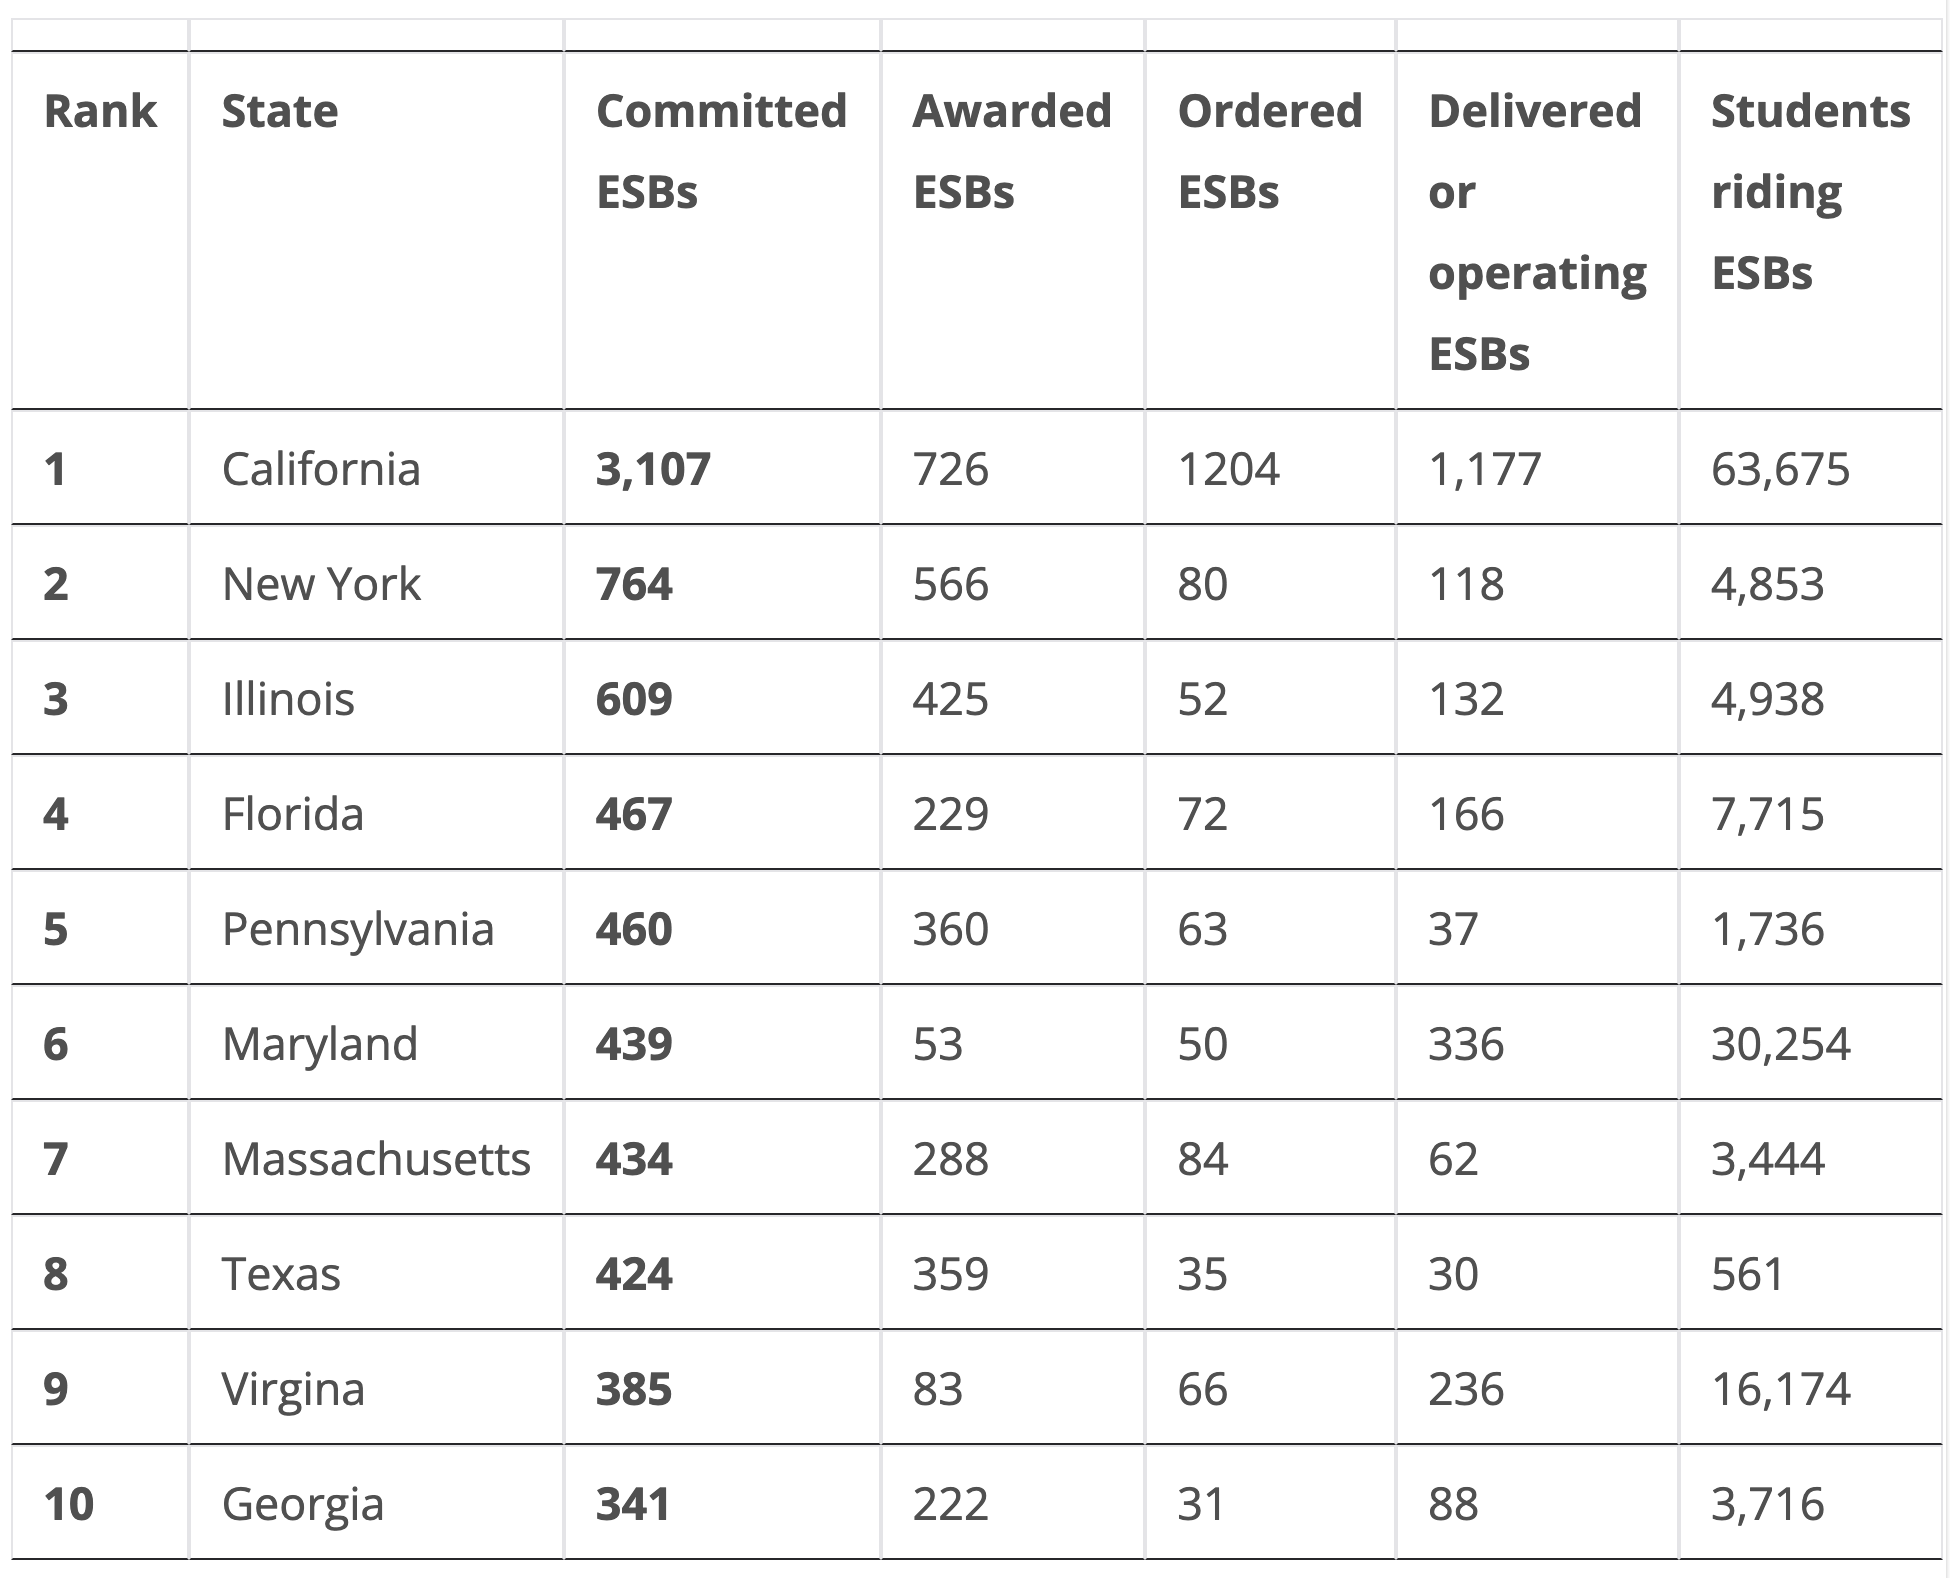
Using data from the World Resources Institute’s Electric School Bus Dashboard, the following table shows the status of total committed electric school buses (ESBs), awarded ESBs, ordered ESBs, delivered or operating ESBs, and the number of students riding ESBs for each state. The World Resources Institute considered electric school buses “committed” while in any of the four stages of adoption: awarded, ordered, delivered or operating — so long as “a school district or fleet operator has been awarded funding to purchase it or makes a formal agreement to purchase to purchase it from a manufacturer — not when they have only expressed intent to acquire one.”
At the time the data was collected in May 2024, 48 states had electric school buses delivered or in operation, with the exceptions of Wyoming and Idaho.
As of August 1, 2024, the top states for committed electric school buses are listed below:
Top 10 states for committed electric school buses as of 8/1/2024

States with the fewest committed electric school buses included Delaware, Alaska and Wyoming. For a complete ranking of committed electric school buses by state, see Appendix B.
Recommendations
For school districts
- Set a goal to end the purchase of new fossil fuel buses and transition to a 100% zero-emission fleet. This can send an important market signal and help bring the school community together behind a single goal.
- Have an account on www.SAM.gov, which is a precursor to applying for federal funds. It is free to set up an account and three additional rounds of funding will be available through 2026.
- Explore all possible financing options:
- Start a conversation with your utility company as early as possible to see what resources they can provide. Many utilities offer consulting services to assess wiring and charging needs or rebates to reduce the costs of the wiring upgrades and infrastructure installation. In addition, work with your utility to ensure a competitive charging price system is in place.
For lawmakers
- Dedicate dollars to zero-emission, electric school buses
- Identify and remove barriers to incentivize utility companies to develop effective and consistent rates for electric school bus charging, particularly around peak demand rates.
- Support research and development in electric school bus technology, including vehicle-to-grid and vehicle-to-building technology.
For utilities
- Continue to increase renewable energy capacity on the grid, making electric buses even cleaner.
- Develop turnkey programs to assist school districts in assessing their charging needs and providing incentives for charging infrastructure.
- Financially support research and development in electric school bus technology, including vehicle-to-grid and vehicle-to-building technology.
- Establish bulk purchase savings programs to lower costs for school districts.
- Create pricing structures that incentivize school districts to use vehicle-to-building and/or vehicle-to-grid opportunities from school buses
For parents and students
- Call on your school board to convert to electric school buses by passing a resolution to transition the fleet to 100% electric buses and only purchase electric school buses moving forward.
- Share information about electric school buses at PTA meetings and other educational forums to increase understanding of the benefits for students and school districts. Organize an event where students, parents and the community can experience riding an electric school bus.
- Recruit volunteers to help with grant writing for smaller school districts to compete for this money.
Resources
Appendix A
| Federal and State Funding for Electric School Buses (5/29/24) – data from Atlas Public Policy | ||
| Rank | State | Total Funding |
| 1 | California | $684,092,571 |
| 2 | New York | $237,705,929 |
| 3 | Illinois | $223,820,312 |
| 4 | Texas | $184,792,970 |
| 5 | Michigan | $167,740,803 |
| 6 | Florida | $160,042,734 |
| 7 | Georgia | $159,529,307 |
| 8 | Louisiana | $144,141,664 |
| 9 | Pennsylvania | $143,859,350 |
| 10 | Massachusetts | $138,167,785 |
| 11 | Wisconsin | $127,931,889 |
| 12 | North Carolina | $106,486,639 |
| 13 | Ohio | $104,654,779 |
| 14 | Virginia | $96,688,873 |
| 15 | Minnesota | $93,502,994 |
| 16 | Missouri | $93,358,781 |
| 17 | Mississippi | $91,613,989 |
| 18 | Oklahoma | $79,774,605 |
| 19 | Colorado | $76,139,322 |
| 20 | Arizona | $75,376,503 |
| 21 | South Carolina | $73,935,000 |
| 22 | Connecticut | $73,264,508 |
| 23 | Washington | $69,208,805 |
| 24 | Oregon | $63,962,000 |
| 25 | New Jersey | $60,074,725 |
| 26 | Indiana | $59,783,065 |
| 27 | Tennessee | $57,629,250 |
| 28 | Kansas | $41,570,000 |
| 29 | Kentucky | $40,013,020 |
| 30 | Arkansas | $38,605,000 |
| 31 | New Hampshire | $34,865,000 |
| 32 | Maryland | $33,986,421 |
| 33 | Montana | $27,690,382 |
| 34 | Nebraska | $26,735,000 |
| 35 | Alabama | $25,242,558 |
| 36 | Rhode Island | $23,470,000 |
| 37 | West Virginia | $22,345,000 |
| 38 | Maine | $20,550,000 |
| 39 | Iowa | $20,500,000 |
| 40 | North Dakota | $19,442,375 |
| 41 | Utah | $19,155,660 |
| 42 | Nevada | $17,579,604 |
| 43 | District of Columbia (D.C.) | $14,450,000 |
| 44 | Vermont | $11,972,791 |
| 45 | New Mexico | $11,521,687 |
| 46 | Idaho | $8,295,000 |
| 47 | Hawaii | $4,844,660 |
| 48 | South Dakota | $3,127,857 |
| 49 | Delaware | $965,681 |
| 50 | Alaska | $802,465 |
| 51 | Wyoming | $0 |
Appendix B
Committed Electric School Buses Ranked by State as of 8/1/24
| Rank | State | Committed ESBs | Awarded ESBs | Ordered ESBs | Delivered or operating ESBs | Students riding ESBs |
| 1 | California | 3,107 | 726 | 1204 | 1,177 | 63,675 |
| 2 | New York | 764 | 566 | 80 | 118 | 4,853 |
| 3 | Illinois | 609 | 425 | 52 | 132 | 4,938 |
| 4 | Florida | 467 | 229 | 72 | 166 | 7,715 |
| 5 | Pennsylvania | 460 | 360 | 63 | 37 | 1,736 |
| 6 | Maryland | 439 | 53 | 50 | 336 | 30,254 |
| 7 | Massachusetts | 434 | 288 | 84 | 62 | 3,444 |
| 8 | Texas | 424 | 359 | 35 | 30 | 561 |
| 9 | Virginia | 385 | 83 | 66 | 236 | 16,174 |
| 10 | Georgia | 341 | 222 | 31 | 88 | 3,716 |
| 11 | Michigan | 315 | 188 | 67 | 60 | 2,153 |
| 12 | New Jersey | 306 | 167 | 2 | 137 | 5,553 |
| 13 | Louisiana | 283 | 259 | 4 | 20 | 1,359 |
| 14 | North Carolina | 263 | 178 | 14 | 71 | 4,002 |
| 15 | Oregon | 246 | 189 | 14 | 43 | 2,048 |
| 16 | Missouri | 229 | 159 | 14 | 56 | 2,227 |
| 17 | Washington | 222 | 128 | 15 | 79 | 2,498 |
| 18 | Connecticut | 211 | 166 | 0 | 45 | 2,444 |
| 19 | South Carolina | 195 | 181 | 0 | 14 | 832 |
| 20 | Arizona | 186 | 161 | 7 | 18 | 756 |
| 21 | Mississippi | 165 | 107 | 0 | 58 | 2,610 |
| 22 | Ohio | 165 | 150 | 9 | 6 | 285 |
| 23 | Colorado | 144 | 70 | 28 | 46 | 2,070 |
| 24 | Wisconsin | 141 | 117 | 4 | 20 | 745 |
| 25 | Oklahoma | 138 | 62 | 11 | 65 | 2,925 |
| 26 | New Hampshire | 117 | 113 | 0 | 4 | 200 |
| 27 | Indiana | 104 | 65 | 4 | 35 | 1,352 |
| 28 | Kentucky | 104 | 47 | 6 | 51 | 2,219 |
| 29 | Minnesota | 101 | 88 | 4 | 9 | 325 |
| 30 | West Virginia | 99 | 52 | 37 | 10 | 470 |
| 31 | Tennessee | 86 | 41 | 26 | 19 | 1,059 |
| 32 | Montana | 81 | 64 | 1 | 16 | 334 |
| 33 | Rhode Island | 79 | 45 | 24 | 10 | 561 |
| 34 | Arkansas | 78 | 72 | 2 | 4 | 196 |
| 35 | Maine | 78 | 36 | 20 | 22 | 1,133 |
| 36 | Alabama | 70 | 48 | 14 | 8 | 331 |
| 37 | Kansas | 64 | 50 | 0 | 14 | 638 |
| 38 | Iowa | 60 | 41 | 1 | 18 | 671 |
| 39 | Nevada | 57 | 25 | 10 | 22 | 1,094 |
| 40 | Vermont | 39 | 21 | 1 | 17 | 847 |
| 41 | Utah | 36 | 14 | 0 | 22 | 1,270 |
| 42 | New Mexico | 34 | 23 | 5 | 6 | 464 |
| 43 | Hawaii | 23 | 20 | 0 | 3 | 149 |
| 44 | Idaho | 23 | 10 | 13 | 0 | 0 |
| 45 | Nebraska | 23 | 19 | 0 | 4 | 33 |
| 46 | North Dakota | 18 | 11 | 0 | 7 | 130 |
| 47 | South Dakota | 8 | 2 | 0 | 6 | 132 |
| 48 | Delaware | 5 | 3 | 1 | 1 | 82 |
| 49 | Alaska | 2 | 0 | 1 | 1 | 82 |
| 50 | Wyoming | 0 | 0 | 0 | 0 | 0 |
Source: Electric School Bus Data Dashboard, State ESB Adoption tab, World Resources Institute, data accessed 8/1/24
Appendix C
Committed electric school buses by state alphabetical as of 8/1/2024
| State | Committed ESBs | Awarded ESBs | Ordered ESBs | Delivered or operating ESBs | Students riding ESBs |
| Alabama | 70 | 48 | 14 | 8 | 331 |
| Alaska | 2 | 0 | 1 | 1 | 82 |
| Arizona | 186 | 161 | 7 | 18 | 756 |
| Arkansas | 78 | 72 | 2 | 4 | 196 |
| California | 3,107 | 726 | 1204 | 1,177 | 63,675 |
| Colorado | 144 | 70 | 28 | 46 | 2,070 |
| Connecticut | 211 | 166 | 0 | 45 | 2,444 |
| Delaware | 5 | 3 | 1 | 1 | 82 |
| Florida | 467 | 229 | 72 | 166 | 7,715 |
| Georgia | 341 | 222 | 31 | 88 | 3,716 |
| Hawaii | 23 | 20 | 0 | 3 | 149 |
| Idaho | 23 | 10 | 13 | 0 | 0 |
| Illinois | 609 | 425 | 52 | 132 | 4,938 |
| Indiana | 104 | 65 | 4 | 35 | 1,352 |
| Iowa | 60 | 41 | 1 | 18 | 671 |
| Kansas | 64 | 50 | 0 | 14 | 638 |
| Kentucky | 104 | 47 | 6 | 51 | 2,219 |
| Louisiana | 283 | 259 | 4 | 20 | 1,359 |
| Maine | 78 | 36 | 20 | 22 | 1,133 |
| Maryland | 439 | 53 | 50 | 336 | 30,254 |
| Massachusetts | 434 | 288 | 84 | 62 | 3,444 |
| Michigan | 315 | 188 | 67 | 60 | 2,153 |
| Minnesota | 101 | 88 | 4 | 9 | 325 |
| Mississippi | 165 | 107 | 0 | 58 | 2,610 |
| Missouri | 229 | 159 | 14 | 56 | 2,227 |
| Montana | 81 | 64 | 1 | 16 | 334 |
| Nebraska | 23 | 19 | 0 | 4 | 33 |
| Nevada | 57 | 25 | 10 | 22 | 1,094 |
| New Hampshire | 117 | 113 | 0 | 4 | 200 |
| New Jersey | 306 | 167 | 2 | 137 | 5,553 |
| New Mexico | 34 | 23 | 5 | 6 | 464 |
| New York | 764 | 566 | 80 | 118 | 4,853 |
| North Carolina | 263 | 178 | 14 | 71 | 4,002 |
| North Dakota | 18 | 11 | 0 | 7 | 130 |
| Ohio | 165 | 150 | 9 | 6 | 285 |
| Oklahoma | 138 | 62 | 11 | 65 | 2,925 |
| Oregon | 246 | 189 | 14 | 43 | 2,048 |
| Pennsylvania | 460 | 360 | 63 | 37 | 1,736 |
| Rhode Island | 79 | 45 | 24 | 10 | 561 |
| South Carolina | 195 | 181 | 0 | 14 | 832 |
| South Dakota | 8 | 2 | 0 | 6 | 132 |
| Tennessee | 86 | 41 | 26 | 19 | 1,059 |
| Texas | 424 | 359 | 35 | 30 | 561 |
| Utah | 36 | 14 | 0 | 22 | 1,270 |
| Vermont | 39 | 21 | 1 | 17 | 847 |
| Virginia | 385 | 83 | 66 | 236 | 16,174 |
| Washington | 222 | 128 | 15 | 79 | 2,498 |
| West Virginia | 99 | 52 | 37 | 10 | 470 |
| Wisconsin | 141 | 117 | 4 | 20 | 745 |
| Wyoming | 0 | 0 | 0 | 0 | 0 |
Source: Electric School Bus Data Dashboard, State ESB Adoption tab, World Resources Institute, data accessed 8/1/24
Have a tip for CleanTechnica? Want to advertise? Want to suggest a guest for our CleanTech Talk podcast? Contact us here.
Latest CleanTechnica.TV Videos
CleanTechnica uses affiliate links. See our policy here.
CleanTechnica’s Comment Policy


-VectorRGB-FINAL.jpg)
