Sign up for daily news updates from CleanTechnica on email. Or follow us on Google News!
A very unique change in the shape of the electric load met by conventional power plants develops when increasing levels of PV are added to the system. This phenomenon was first observed and published in a paper by NREL in 2008. The phenomenon was then later confirmed in more detail by the California Independent System Operator (CAISO) in 2013. Since then (thanks to CAISO), this phenomenon is now famously known as the Duck Curve.
According to the US Department of Energy (DOE), the duck curve (named after its resemblance to a duck), “shows the difference in electricity demand and the amount of available solar energy throughout the day. When the sun is shining, solar floods the market and then drops off as electricity demand peaks in the evening. The duck curve is a snapshot of a 24-hour period in California during springtime — when this effect is most extreme because it’s sunny, but temperatures remain cool, so demand for electricity is low since people aren’t using electricity for air conditioning or heating.”
Meanwhile, on the other side of the world, South Africans have been ramping up installations of distributed solar in a big way to shield themselves from frequent electricity rationing cycles, and it seems that they have now installed a significant amount and we are starting to see the early signs of a prominent duck curve. Lets take a look as some of the key highlights of South Africa’s electricity landscape.

South Africa has a nominal installed electricity generation capacity (utility-scale plants only) of 54.7 GW, 72.4% of which is from coal power plants. Utility-scale wind, solar PV, and concentrated solar’s contribution to this stand at 3.4 GW, 2.3 GW, and 0.5 GW respectively, as illustrated in this beautiful chart courtesy of The Centre For Renewable & Sustainable Energy Studies (CRSES).
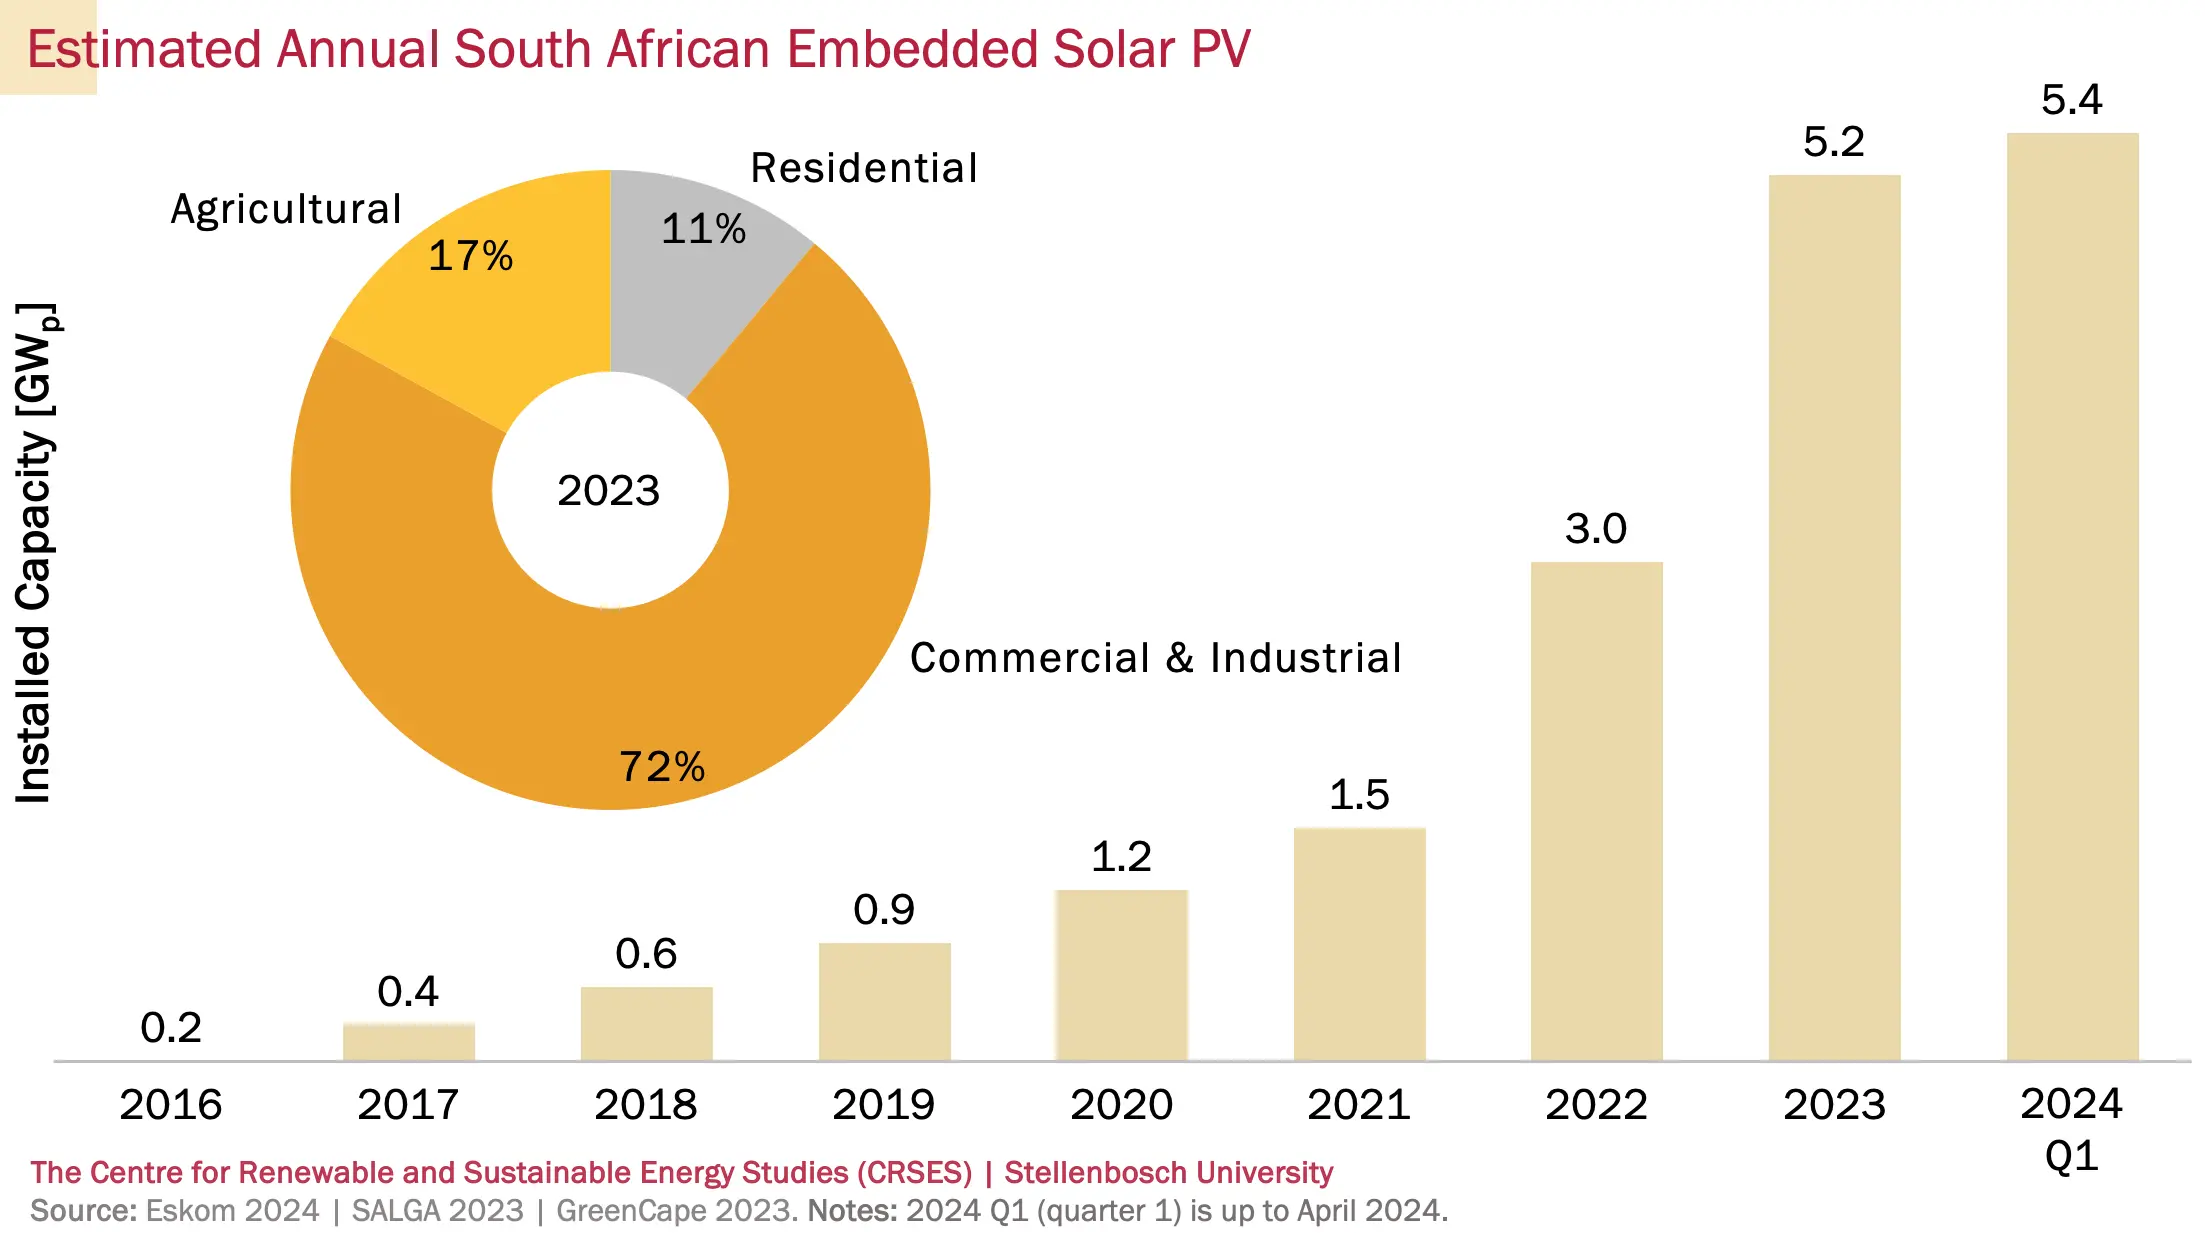
Another nice chart from CRSES illustrates the tremendous growth in the distributed solar PV sector as homes and business rushed to install solar PV. South Africa’s national electricity utility company Eskom estimates that there is now over 5.4 GW of distributed solar PV installed in South Africa.

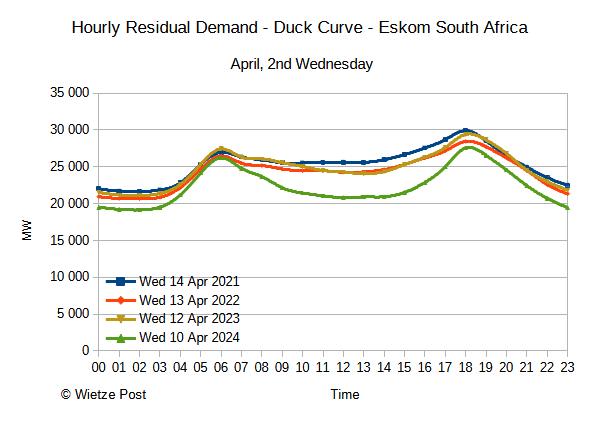
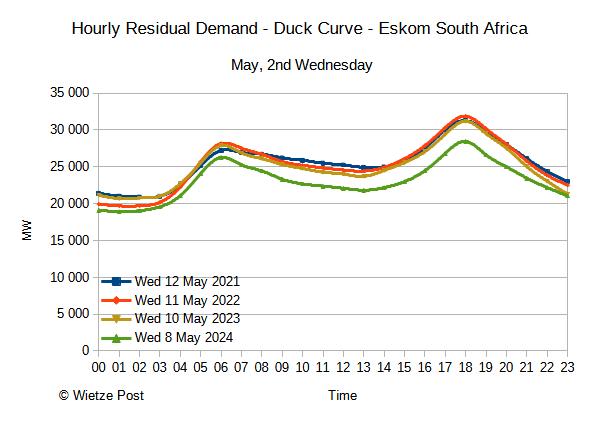
This growth in distributed solar PV, plus the 2.3GW of utility-scale PV, is now contributing to South Africa’s own duck curve, according to data shared recently by Wietze Post who has been tracking these developments. As illustrated in the following chart by Wietze, and looking at data from April and May from 2021 to 2024, plus the corresponding increase in solar PV installations in South Africa, one can clearly see that South Africa’s duck curve is starting to get more prominent. During the months of April and May, it is mostly sunny in South Africa, compared to February and March, when it rains quite a bit. The corresponding data for February and March is also shown below.


Hourly residual demand in South Africa, April and May from 2021 to 2024. Chart by Wietze Post
Wietze also notes that the small progressive dip in the evening demand over the years could be due to installed batteries picking up some of the night-time demands, while most of the installed batteries may not be able to last the whole night, hence the absences of a similar dip during the mornings.
Solar PV systems, especially in homes, and now also increasingly in the C&I sector in South Africa, are usually coupled with lithium-based batteries systems as homes and businesses move to shield themselves from frequent electricity rationing cycles. The electricity situation has improved though over the past few months with very minimal to no load-shedding at all in South Africa.


A record amount of proposed solar plants were registered with South Africa’s energy regulator last year. With all these plants being at various stages of developments, a whole lot more solar PV will come online in the next year, meaning that South Africa’s duck curve will be even more prominent this time next year.
Have a tip for CleanTechnica? Want to advertise? Want to suggest a guest for our CleanTech Talk podcast? Contact us here.
Latest CleanTechnica.TV Videos
CleanTechnica uses affiliate links. See our policy here.


