Gold’s record-shattering breakout surge during the past six weeks has proven magnificent! Sustained momentum-chasing buying outside of normal channels has fueled these sharp gains, which gold miners’ stocks are increasingly leveraging. But such big-and-fast surges are leaving traders wondering if gold and gold stocks have rallied too far too fast. Resulting excessive overboughtness can force rebalancing selloffs.
Financial markets are forever cyclical, perpetually flowing and ebbing. Rallies are followed by pullbacks, uplegs by corrections, and bulls by bears. The primary force driving these cycles is herd sentiment, how traders feel about sectors. This popular psychology endlessly swings between greed and fear like a giant pendulum. Major toppings happen at the bullish end of its arc, and major bottomings on the bearish side.
Gold’s prevailing sentiment today is surprising. Between mid-February to early April gold has blasted 18.1% higher, with 7/8ths of those gains since March dawned. Those six weeks since have seen fully 16 new nominal record closes, 4/7ths of all trading days! Such a massive record-shattering breakout surge should’ve spawned widespread greed if not euphoria. Yet Western investors are still hardly paying attention.
The combined bullion holdings of the mighty American GLD and IAU gold ETFs are the best daily high-resolution proxy for Western investment demand. Since mid-February when gold’s last mild pullback bottomed at $1,991, those have actually slumped 1.5%. Gold’s full upleg born in early October has powered 29.2% higher at best, yet GLD+IAU holdings somehow suffered a shocking 5.2% draw in that span!
This is unprecedented, something I’ve never seen before in a quarter-century intensely studying and actively trading gold and gold stocks. Western investors remain largely indifferent to gold, enamored by this latest stock-market bubble. Recent months’ powerful gold upleg has apparently been fueled by major buying out of Asia, particularly Chinese investment demand. China has all kinds of economic problems.
Its stock markets have been mauled by a deepening secular bear in recent years. Confidence in Chinese stocks has been seriously damaged, with many government interventions failing to stanch the bleeding. The aftermath of a burst bubble in Chinese housing has also crushed real-estate prices. So investors looking for assets not exposed to China’s troubled economy have been flocking to gold, catapulting it higher.
Ethereal sentiment can’t be measured directly, it must be inferred. Normally how far prices stretch from key baselines reveals excessive herd greed or fear. Big-and-fast surges generate the former, while sharp plunges spawn the latter. Nearly two decades ago I created a trading system called Relativity to quantify this. It simply looks at prices relative to their underlying 200-day moving averages, actually as multiples of them.
Those 200dmas common in many price charts make fantastic baselines. They are dynamic, gradually evolving over time to reflect prevailing price trends and levels. Yet they still change slowly enough that any outsized price moves force big deviations away from them. To the upside and downside those reflect popular greed and fear respectively. Traders grow excited as prices blast higher but depressed as they tumble.
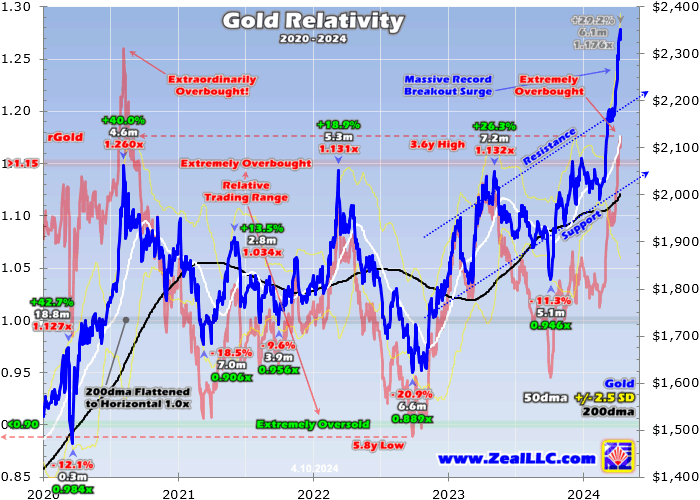
Midweek gold’s latest record close divided by that day’s 200dma yielded a Relative Gold or rGold multiple running 1.176x. In other words, gold was stretched 17.6% above its 200dma. Without context that is meaningless, but when charted over time Relativity multiples often form horizontal trading ranges. These flatten 200dmas to 1.00x, and then render all price fluctuations around them in constant-percentage terms.
This rGold chart superimposes normal gold prices and key technicals including that 200dma over those rGold multiples. To define Relativity trading ranges to help guide the extensive gold-stock trading in our subscription newsletters, I analyze the last five calendar years of data. The current Relative Gold range runs from gold being extremely oversold under 0.90x its 200dma to extremely overbought above 1.15x.
So gold stretched way up to 1.176x its 200dma midweek is well into that extremely-overbought territory! Other traditional overboughtness-oversoldness indicators concur, including the Relative Strength Index and stochastics. Per Relativity, gold hasn’t been this hugely overbought in 3.6 years since mid-August 2020. And paradoxically that comparison is both damning and encouraging, simultaneously bearish and bullish.
Back in mid-2020, a monster gold upleg skyrocketed emerging from March’s pandemic-lockdown stock panic. Gold soared a scorching 40.0% higher in just 4.6 months, shooting to a parabolic climax way up at an extraordinarily-overbought 1.260x its 200dma! And that stretching was even more extreme since that key baseline itself was rising sharply. Gold’s euphoric $2,062 peak then wouldn’t be bested for fully 3.3 years.
That 1.260x rGold extreme was a heck of a lot higher than today’s 1.176x. But back then surging from the latter to the former only took a couple weeks. When popular greed waxes extreme and traders rush to chase vertical gains, buying exhaustion quickly follows. Soon such frenzied parabolic surges attract in all-available near-term capital. Once all traders wanting to chase that big momentum are in, only sellers remain.
Extreme overboughtness doesn’t guarantee imminent plunges, but the risks of them are proportional to that overboughtness. After hitting that 1.260x in early August 2020, gold plummeted 7.5% in just three trading days! In less than seven weeks, those losses extended to 9.8%. Gold would ultimately correct a major 18.5% in 7.0 months after that extreme vertical ascent, threatening new-bear-market territory down 20%+.
With gold stretched 17.6% above its 200dma this week, a sharp plunge could again happen any time. Those are necessary to bleed off excessive greed, restoring sentiment balance. But that doesn’t mean traders need to preemptively sell gold-related positions. Parabolas can keep surging as long as they’re able to attract new momentum-chasing buyers. American stock investors haven’t even started buying yet!
Again GLD+IAU holdings have slumped 5.2% during today’s 29.2% gold upleg since early October, an incredible anomaly. During mid-2020’s 40.0% upleg, they flooded into gold so aggressively that GLD+IAU holdings skyrocketed 35.3% during that span! That made for a colossal 460.5-metric-ton build then, compared to a 66.1t draw today. So when American stock investors return, today’s gold upleg will grow way bigger.
And odds are they will soon start chasing gold’s upside. That monster mid-2020 upleg was the last one where gold achieved new record-high streaks. Those drive expanding and increasingly-bullish financial-media coverage, which is already happening now. As Bloomberg, CNBC, and the Wall Street Journal do more reporting on gold’s magnificent breakout surge, more speculators and investors are becoming aware.
In financial markets buying begets buying, forming powerful virtuous circles of capital inflows. The faster and higher prices rally, the more traders notice and want to ride those gains. Their buying accelerates the surging, attracting in widening circles of traders. Overboughtness doesn’t matter if capital is still flooding into a soaring sector. Bitcoin recently proved this, skyrocketing stratospheric to 2.032x its 200dma in mid-March!
So extreme overboughtness doesn’t mean traders should scramble to exit gold trades. But they do need to prepare for the far-higher risks for big-and-fast plunges. One way is ratcheting up trailing stop losses to lock in more unrealized gains in case gold suddenly turns south. Since parabolic surges can balloon so massive, traders want to stay deployed as long as possible. And prices don’t have to collapse after those.
Usually they do, fast plunges are the normal way extreme overboughtness and greed are rebalanced. But sometimes surging prices simply consolidate high, with buying not yet exhausted so sellers can’t quite seize the upper hand. Sideways drifts after parabolic ascents also bleed off excessive greed, but with a much-slower pace. They might take a few months to mature, compared to a few weeks for sharp selloffs.
Gold stretching way up to 1.176x its 200dma midweek certainly makes me nervous, worrying about an out-of-the-blue plunge. But because American stock investors haven’t yet started chasing gold, and today’s upleg remains considerably smaller than mid-2020’s last record-achieving one, and gold’s 200dma isn’t yet rising sharply like back then, I don’t expect an imminent plunge despite high risks for one.
Another key mitigating factor is speculators’ gold-futures positioning, which isn’t seeing exhausted buying. Major gold uplegs are fueled by three sequentially-larger stages of buying. The first is gold-futures short covering birthing uplegs, the second is gold-futures long buying, and the third is gold investment buying. The first two stages drive gold high enough for long enough to ignite the subsequent much-bigger ones.
Specs’ gold-futures-positioning data is published weekly, which I analyze in depth in all our weekly and monthly newsletters. Like that rGold multiple, spec positioning tends to form trading ranges over time. Based on those, when today’s gold upleg was born at $1,820 in early October specs had room for a probable 229.6k contracts of short covering and long buying. Once that is exhausted, they are likely done.
As of the latest early-April data, these traders still had 41% of that total gold-upleg buying remaining! That’s plenty of capital firepower left to drive gold considerably higher before they deplete their buying. The usual slayer of mature gold uplegs is gold-futures speculators exhausting their buying, leaving selling which slams gold lower. Amazingly considering how far gold has run, that’s still nowhere near happening yet.
So today’s extremely-overbought gold upleg still looks surprisingly healthy, although it would sure be nice to see a breather to rebalance sentiment. Ideally that would be a pullback to gold’s 50dma, which is now running $2,125. 50-day moving averages are the strongest support zone for mid-upleg pullbacks. That is also climbing about $6 per day, so a couple weeks from now gold’s 50dma should be closer to $2,185.
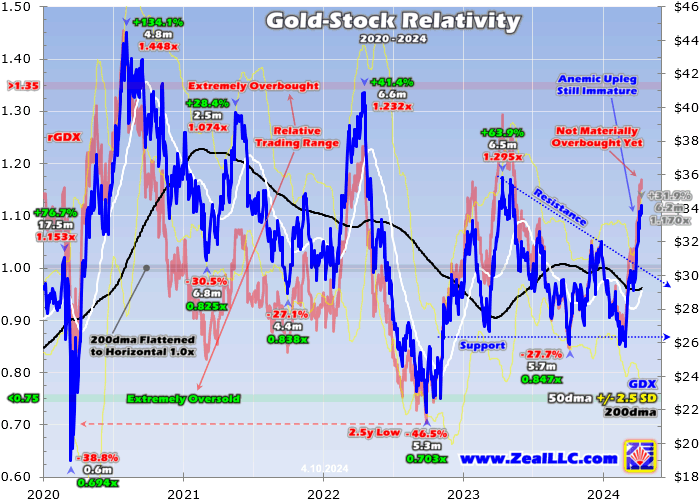
As goes gold, so go its miners’ stocks. The leading gold-stock benchmark remains the GDX gold-stock ETF. Dominated by major gold miners, GDX normally tends to amplify material gold moves by 2x to 3x. That naturally gives gold stocks a wider Relatively trading range than gold, 0.75x to 1.35x GDX’s 200dma over the past five years compared to 0.90x to 1.15x for gold. Unlike it, the gold stocks aren’t overbought yet!
The Relative GDX has only stretched to 1.170x as of midweek, actually less overbought absolutely than gold! A stark contrast to gold’s extreme overboughtness, gold stocks aren’t materially overbought yet. This is both comforting and vexing. Gold stocks have dreadfully underperformed gold so far during this breakout upleg. GDX is only up 31.9% since early October, only leveraging gold’s 29.2% upleg a dismal 1.1x!
If gold stocks just pace gold, they aren’t worth owning. They need to have outsized gains to compensate traders for their big additional operational, geological, and geopolitical risks in addition to gold price trends. Odds are big gains are still coming, as I analyzed in a whole essay last week on gold-stock upside targets. GDX easily has potential to soar another 60%ish higher from here based on past-gold-upleg precedent!
With the rGDX only about halfway up into its secular trading range, unlike their metal gold stocks aren’t threatened with a sharp selloff. They do track gold, which overwhelmingly drives their profits and thus stock prices. So if gold’s parabolic surge collapses, GDX will still follow it lower and almost certainly still amplify its losses. Traders can also prepare for that possibility by ratcheting up their trailing stop losses.
But gold plunging is only one of three likely outcomes. Despite gold’s extreme overboughtness, this upleg doesn’t yet look mature and can run higher. If that ideal 50dma pullback materializes, technical damage in gold stocks should be contained. They will retreat some, but they are so darned undervalued relative to gold that they should prove resilient. Traders haven’t deployed much capital yet since they aren’t interested.
If gold continues powering higher on balance, or resumes that after a pullback, the gold stocks should increasingly soar. While gold-stock upside leverage to gold has been anomalously low, it does tend to mount as gold uplegs mature. The longer and higher gold rallies, the more bullishness, enthusiasm, and greed are generated for gold stocks. The resulting buying accelerates their gains, attracting in even more traders.
Gold’s record-momentum-chasing dynamic also greatly boosts gold-stock sentiment. During that last mid-2020 upleg seeing this play out, GDX skyrocketed 134.1% leveraging gold’s underlying 40.0% upleg by 3.4x! As a gold-stock speculator and financial-newsletter guy, I have Bloomberg and CNBC on in my office all day every day. Their bullish coverage of gold and its miners’ stocks is really growing, building awareness.
While gold stocks’ overall gold-upleg gains remain terrible, they’ve really started catching up. Since late February, GDX has surged 29.7% during gold’s record-breakout surge for much-better 2.0x upside leverage. GDX has reversed from languishing well under its 200dma at 0.899x at the end of February to that 1.170x midweek. So gold-stock gains accelerating as gold’s upleg grows isn’t a hope, it is already happening.
Again as I analyzed last week, gold stocks still have enormous upside potential. They are technically-battered despite gold powering to many new nominal record highs. And they are deeply undervalued, earning fat and fast-growing profits with these high-prevailing gold prices. So this temporary disconnect between gold-stock prices and gold isn’t likely to last. This extreme anomaly is a great buying opportunity.
While gold stocks are building steam, they are only getting started. They have a long ways higher to mean revert merely to reflect today’s prevailing gold prices, let alone where their metal is heading. And while majors dominating GDX can amplify gold upside by 2x to 3x, fundamentally-superior smaller mid-tiers and juniors fare much better. They are better able to consistently grow their gold production at lower costs.
We’ve long specialized in that smaller-gold-stock realm at Zeal, and our newsletter trading books are full of excellent trades. Nearly all have been added within this current gold upleg, and as of midweek their unrealized gains are already running as high as +70.8%! The average across all such trades in our latest newsletters was +37.1%, but all these stocks have the potential to double or triple before this gold upleg matures.
Successful trading demands always staying informed on markets, to understand opportunities as they arise. We can help! For decades we’ve published popular weekly and monthly newsletters focused on contrarian speculation and investment. They draw on my vast experience, knowledge, wisdom, and ongoing research to explain what’s going on in the markets, why, and how to trade them with specific stocks.
Our holistic integrated contrarian approach has proven very successful, and you can reap the benefits for only $10 an issue. We extensively research gold and silver miners to find cheap fundamentally-superior mid-tiers and juniors with outsized upside potential. Sign up for free e-mail notifications when we publish new content. Even better, subscribe today to our acclaimed newsletters and start growing smarter and richer!
The bottom line is gold is extremely overbought today, warning of high risks for a sharp selloff. But even after rallying so far so fast, this powerful gold upleg still looks to have lots of room to run. Mostly fueled by big Chinese investment demand so far, gold-futures speculators have plenty of buying firepower left. And the American stock investors who drive monster gold uplegs haven’t even started chasing this momentum yet.
Though gold miners’ stocks are starting to catch up, they have greatly lagged gold’s big gains. That has left gold stocks anomalously low relative to gold, not materially overbought. But traders are increasingly returning as bullish financial-media coverage grows awareness. Deeply undervalued compared to gold, the gold stocks are likely to skyrocket again in another huge upleg like the last time gold achieved new records.
********


