The relationship between gold and inflation is not usually a positive for gold stocks, but that is changing
I want to call your attention to an article by Jordan Roy Byrne that provides information on “everything you need to know about gold stocks.”
Well, that is one man’s subjective view of the situation, but he is a savvy and well grounded gold market watcher, so the whole article is worth a read. However, the last item caught my attention because as you may know, I have spent a lot of time debunking the well promoted myth that gold stocks should be bought as protection from or utility against inflation.
Nothing could be further from the truth when said inflation is manufactured by monetary/fiscal policy and works to the benefit of the economy before it begins noticeably impairing the economy. There have been long stretches during which the manufactured inflation works positively for the economy.
The proof of the assertions above has been gold’s under-performance to cyclical assets and hence, gold miners’ negative leverage to that performance. It’s not rocket science if you stay unbiased. It’s just the way it is and the way it has been much more often than not during the decades of the Continuum’s gentle disinflationary journey southward. A journey that was rudely sent off course in 2022.
While the Continuum chart (among other things, an indicator of an oncoming era of impaired policymaker ability to respond to financial crises with inflationary ‘bailout’ policy) tempts me to veer from the post’s original focus, I’ll stay on track here. From Jordan’s article:
Whether “the best” indicator for gold stocks or merely one of the best, there is no arguing that Gold/CPI correlates well with the gold miners. One indication this chart holds for me is that of a transition into a counter-cycle as public fear of inflation (confidence that inflation is here to stay) has peaked but remains intact while gold creeps the counter-cyclical environment out ahead (post-election?).
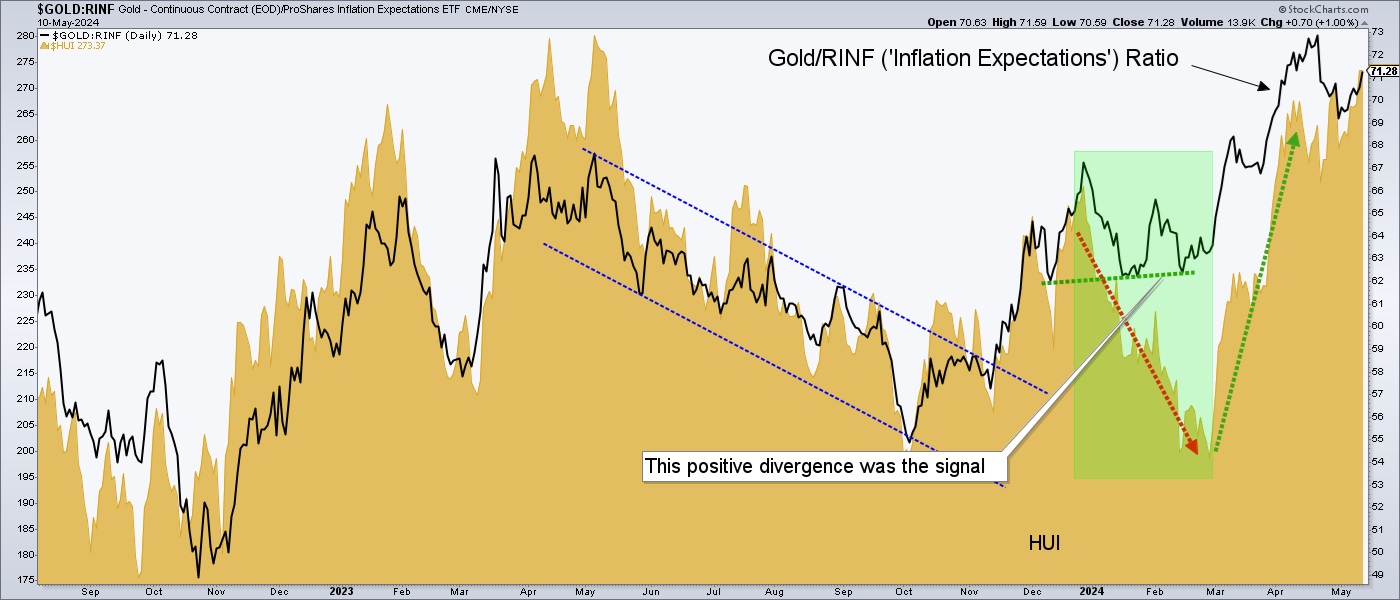
Related to Jordan’s chart above, I have been including this chart of Gold/RINF (inflation expectations) and HUI, on a much shorter time frame, in NFTRH since we identified the positive divergence in Gold/RINF to HUI back in February. Since then Huey has zoomed upward to close the divergence. “Inflation expectations”, “CPI”… different flavors of the same general measure of what the public thinks of as “inflation”.
It will be important to keep these gold ratios (vs. inflation) in view going forward to continue to confirm the oncoming counter-cycle and as such, fundamentally positive era for gold miners, which will finally start to leverage gold’s relative performance to the upside rather than the downside.
For “best of breed” top down analysis of all major markets, subscribe to NFTRH Premium, which includes an in-depth weekly market report, detailed market updates and NFTRH+ dynamic updates and chart/trade setup ideas. Subscribe by Credit Card or PayPal using a link on the right sidebar (if using a mobile device you may need to scroll down) or see all options and more info. Keep up to date with actionable public content at NFTRH.com by using the email form on the right sidebar. Follow via Twitter@NFTRHgt.
*********


