The Copper Monthly Metals Index (MMI) held sideways, although the upside bias continued to accelerate. Supported by a rise among most of its components, the index increased 2.8% from January to February.

25% Tariff Threat Boosts Comex Copper Price
Comex copper prices remained decidedly bullish, jumping even higher on the suggestion that a 25% copper tariff is on the horizon. In an address to Congress, U.S. President Trump stated, “I have also imposed a 25% tariff on foreign aluminum, copper and steel. Tariffs are about making America rich again. It is happening, and it will happen rather quickly.”
Markets had already started pricing in a potential duty after the White House launched an investigation into copper imports in late February. The move was intended to assess national security risks related to America’s foreign dependence on copper imports and followed a barrage of other tariff announcements and threats.

While the administration has yet to announce a final tariff, Trump’s statements surprised markets, which likely anticipated a much smaller duty. As with other metals, the U.S. requires copper imports to meet demand. However, U.S. reliance on imports has grown considerably over the past two decades.
According to USGS, imports accounted for roughly 45% of domestic consumption. Considering rising electrification needs and ongoing grid developments, a 25% duty, should it come to fruition, would significantly impact the domestic copper market.
Keep up with sudden copper prices shift in 2025. Get the latest updates with MetalMiner’s free weekly newsletter.
Markets Remain Well-Supplied as Copper Floods U.S.
The delta between LME and Comex prices is now as wide as ever. While the two exchange contracts continue to loosely mirror one another, Comex prices hold a substantial premium over LME prices, mainly due to the ongoing tariff threats.
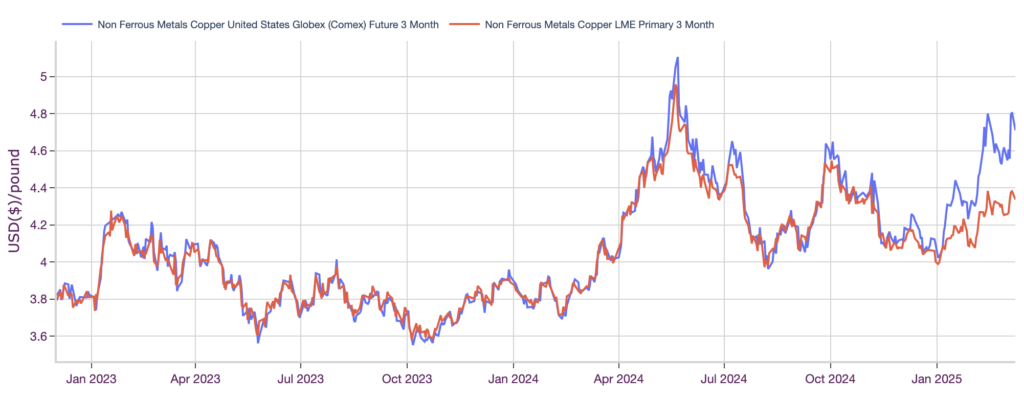
On top of a rush to refill inventories ahead of potential tariffs, that arbitrage caused a sharp increase in Comex inventories starting at the beginning of the year. Stocks now sit at their highest levels in over 6 years. This trend will likely continue in the foreseeable future, or at least as long as the delta between LME and Comex prices remains high.

As the red metal pours into the United States, LME stocks have started to sink. Despite this, LME inventory levels still suggest a well-supplied market, with stocks holding above where they stood over recent years.

Meanwhile, SHFE stocks are in the middle of a rebuild. The last rebuild, in 2024, was large enough to calm markets worried about an impending supply crunch. While it remains unclear where SHFE inventories will find their peak, the current uptrend appears sharp. This has helped global stocks across the three major exchanges climb to their highest levels since 2018.
MetalMiner’s MMI report includes copper and 9 other metal price reports and functions as an economic indicator for contracting, copper price forecasting and predictive analytics. Sign up here.
U.S. Recession, China Deflation Add Copper Price Risk
In the meantime, dark clouds have started to form regarding the health of the global economy. Recession fears have returned, with President Trump telling reporters that the U.S. is in “a period of transition.” The combination of fear and economic uncertainty caused a significant drop in the stock market as investors have started to operate with increased caution.
On the other side of the world, China continues to battle deflation. Unlike in the U.S., where inflation remains sticky, China’s CPI in February fell 0.7% year over year. Not only did it miss expectations, it dropped at its fastest pace in 13 months.
While China continues to invest heavily in renewables and copper-hungry technology, the impact of increased U.S. trade barriers and longstanding issues with its property sector remains a significant demand risk.
Biggest Moves for Copper Prices
Read what’s next for copper prices in this month’s Monthly Metals Outlook. The report provides short- and long-term forecasts plus buying strategies, giving you the edge to navigate market volatility and maximize cost savings. See a free sample report and opt into a subscription.
- U.S. copper producer prices for copper grades 110 witnessed the largest increase of the overall index for the second consecutive month, with a 10.24% rise to $5.92 per pound as of March 1.
- U.S. copper producer prices for copper grade 122 increased by 5.59% to $5.67 per pound.
- U.S. copper producer prices for copper grade 102 rose 5.34% to $5.92 per pound.
- Chinese copper wire scrap prices witnessed a modest 2.59% increase to $9,903 per metric ton.
- LME primary three month copper prices edged 2.51% higher to $9,660 per metric ton.


