Sign up for daily news updates from CleanTechnica on email. Or follow us on Google News!
Study shows that, in most circumstances, customers should maintain low reserves, prioritizing bill savings over backup power
Home battery storage paired with solar photovoltaic (PV) systems can reduce utility bills under certain rate structures while also providing backup power during power interruptions. For power interruptions that come with some warning (such as those caused by hurricanes and other natural disasters), customers are often able to charge up their battery in advance. But many power interruptions come without warning. To guard against this type of outage, most battery storage systems come equipped with a “reserve setting” that allows the customer to maintain some minimum level of storage capacity in reserve. Yet, this feature comes with a tradeoff: the more storage capacity that is held in reserve, the greater the customer’s ability to ride through unpredictable power interruptions, but less capacity is then available to manage utility bills on a day-to-day basis.
The new Berkeley Lab report, entitled Bill Savings vs. Backup Power: Evaluating operational tradeoffs for home solar+storage systems, shows how customers can approach this tradeoff given their particular conditions. The study quantifies how utility bill savings and the reliability value from mitigated power interruptions vary with reserve levels. The analysis leverages Berkeley Lab’s PRESTO model, which stochastically simulates power interruption events based on historical patterns in each U.S. county. The study focuses on ten representative counties and considers a range of common utility rate structures, as well as other key factors, including electricity prices, local reliability levels, and the customer’s value of lost load (VoLL). The study is not a cost-effectiveness evaluation, but rather examines the narrow question of how the value of battery storage to the host customer is impacted by the reserve settings. Other important methodological details and limitations are summarized in the report.
Key findings from the report are highlighted below and will be discussed in an upcoming webinar on October 23rd at 11:00 am Pacific. Please register for the webinar here: https://lbnl.zoom.us/webinar/register/WN_xFm0GAPuRHSnoeoGq40tiQ
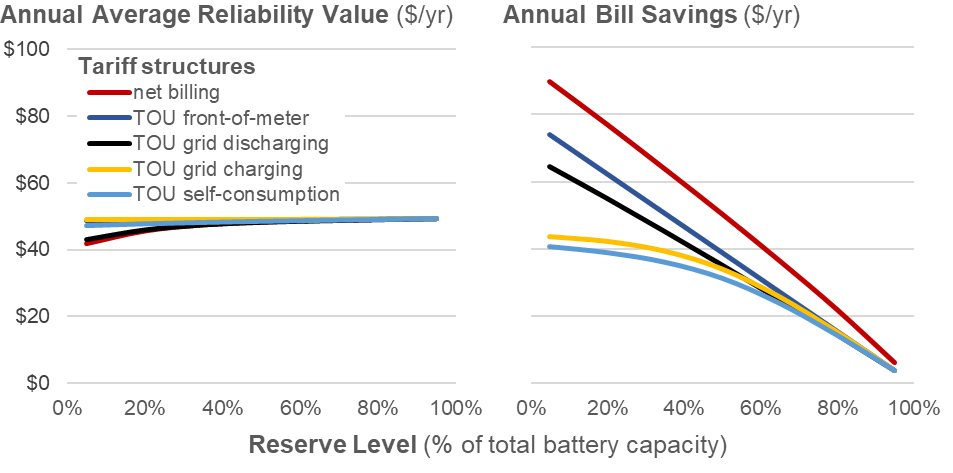
Reliability value is (surprisingly) insensitive to reserve level under most conditions. The reliability value of the backup power provided by the solar+storage system increases with reserve level, but only modestly in most circumstances. For example, as shown in the left-hand panel of Figure 1, the average annual reliability value for a typical customer in Memphis rose by just $1-10/year when increasing reserves from 20% to 80% of the battery’s capacity. All other study regions showed similar trends as well, as shown in the report. The general “flatness” of these trends partly reflects the limited amount of backup load for the battery to serve during an average year, given the typical frequency and duration of power interruptions in most locations. The study also includes sensitivities exploring more frequent power interruptions, given the varying reliability levels that individual customers may experience within any given county.
Bill savings drop precipitously with higher reserves. Storage generates bill savings by arbitraging between low and high prices, under either time-of-use (TOU) rates with peak and off-peak prices, or net billing rates that compensate solar exports at prices below retail rates. As shown in the right-hand panel of Figure 1, the bill savings from storage arbitrage decline substantially with higher reserves, albeit to differing degrees depending on the specific tariff structure. For example, under TOU rates where grid discharging is not allowed (the two bottom lines), the decline in bill savings is quite gradual for reserve levels up to roughly 40%, as the battery would rarely discharge below that level. To be sure, the example shown in Figure 1 is based on a pricing differential of just $0.05/kWh. With a higher pricing differential, the bill savings at low reserve levels would be higher, and the drop in bill savings with increasing reserves would be even more pronounced.

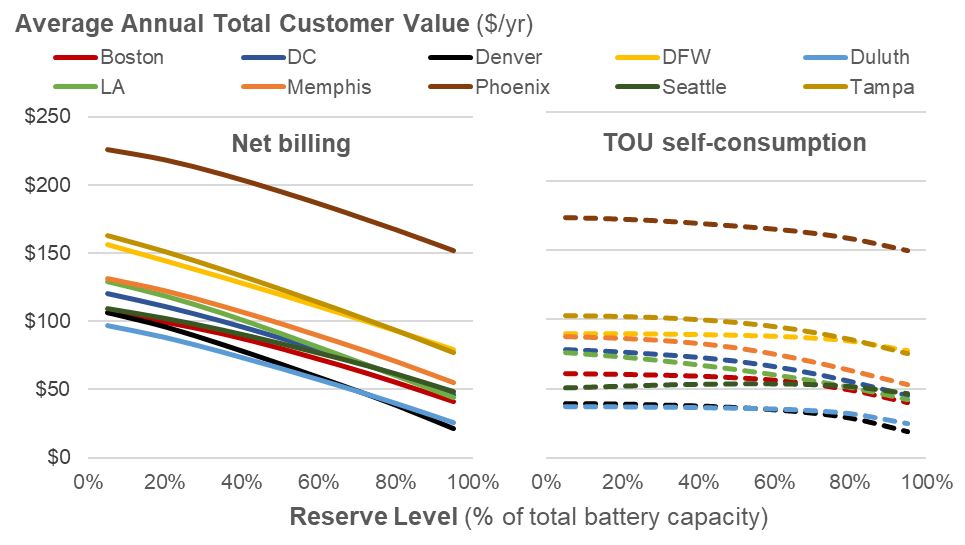
Total customer value tends to be greatest when reserves are set as low as allowed. Given the two findings above, total customer value—that is, the sum of customer reliability value and bill savings—tends to decline with higher reserves, corresponding to the drop in bill savings. Figure 2 shows this trend across all ten study locations, for the two “bookend” tariff structures: net billing and TOU self-consumption. All locations show monotonically declining customer value as reserves rise. This is true for both tariff structures, though the decline in total customer value under the TOU self-consumption tariff is considerably less pronounced, and so customers on that type of tariff may be somewhat indifferent to changes in reserve level (at least up to some point).

Higher reserve levels may increase total customer value for customers with an exceptionally high value of lost load, living in areas with exceptionally frequent power interruptions. The study included scenarios where customers have a higher value of lost load (VoLL) and/or live in locations with more frequent power interruptions (SAIFI), compared to their county average. Figure 3 shows how the total customer value changes across these sensitivities as the reserve level is increased from 20% to 80%: that is, a negative value indicates that total customer value declines with increasing reserves, while a positive value indicates that total customer value increases. As shown in Figure 3, only in the case where the customer has ten times the base-case VoLL ($50/kWh) and also ten times the average SAIFI (roughly 10 interruptions per year, for Memphis) do the results flip, and total customer value rises with reserves. However, even that exception is limited to particular tariff structures (net billing and TOU rates that allow only grid discharging). Furthermore, as shown in the report, larger price differentials can shift the economics back toward lower reserve levels.

The full report provides a wealth of additional detail and results, including more detailed quantitative findings for each location analyzed, as well as sensitivity cases for battery size (i.e., 10 kWh vs. 30 kWh battery), alternate rate levels (including higher price arbitrage levels and different base prices), and customer usage levels (including a low consumption and high consumption case). While the report generally suggests that customers will maximize their value by maintaining the lowest level of reserves allowed, the findings also show how the specific circumstances of any individual customer should be considered when making decisions about reserve level settings.
The study builds on earlier work published by the Berkeley Lab team (here and here), evaluating the capabilities of solar+storage in providing backup power over long multi-day interruptions.
We thank the U.S. Department of Energy Solar Energy Technologies Office for their support of this work, as well as members of the external technical advisory group and other external reviewers who provided invaluable guidance and feedback on this analysis.
Courtesy of Galen Barbose, Will Gorman, and the rest of the study’s authors.
The views expressed here do not necessarily represent the views of the U.S. Department of Energy or the U.S. Government.

Have a tip for CleanTechnica? Want to advertise? Want to suggest a guest for our CleanTech Talk podcast? Contact us here.
Latest CleanTechnica.TV Videos
CleanTechnica uses affiliate links. See our policy here.
CleanTechnica’s Comment Policy


