 As mentioned in my prior articles, Gold was in the range where a key peak was expected to form, and with that was due for a sharp correction, first with a tracked 72-day wave, but ideally also with a larger 310-day component. Having said that, a sharp, short-term rally was expected to play out in-between.
Gold’s 72-Day Cycle
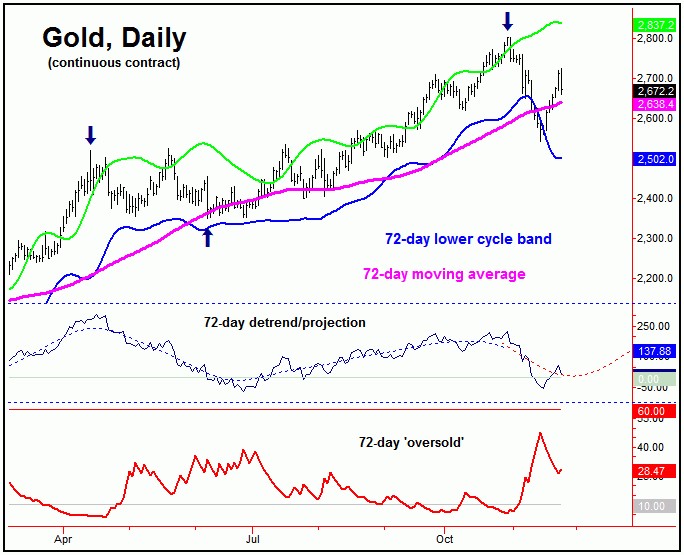
The 72-day cycle is currently the most dominant cycle in the Gold market, and is shown on the chart below:
From my 11/17/24 article: “the analysis called for a drop back the 72-day moving average for Gold, which has obviously been met with the sharp decline. In terms of time, the detrend that tracks our 72-day wave has now locked in on the late-November to early-December window for its next trough to form.”
As mentioned above, our outlook favored a drop back to the 72-day moving average for Gold, which was seen into the most recent swing low. In terms of time, the detrend that tracks this 72-day wave had adjusted its bottoming estimate to the late-November to mid-December timeframe.
While there is at least the potential for this 72-day wave to have troughed at the 2541.50 swing low (December, 2024 contract), the ideal path favored a sharp short-term rally, followed by a push back to or below that figure, to complete that bottom.
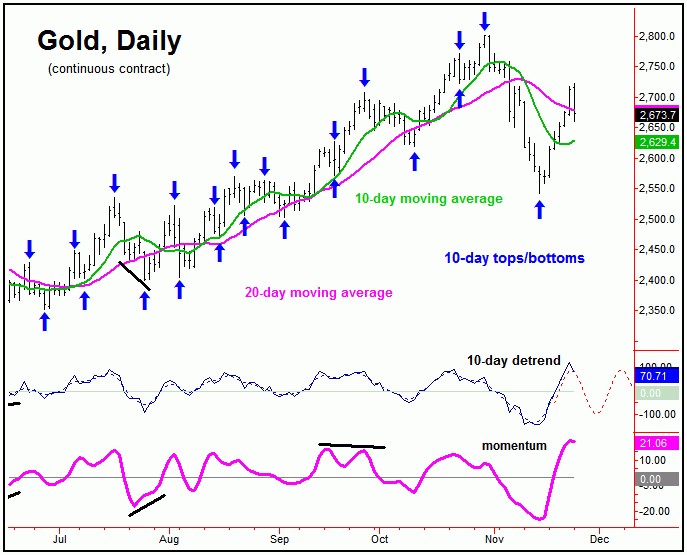
From my 11/17/24 article: “the metal should be at or nearing a very sharp short-term rally, coming from the smallest cycle that we track, the 10-day component. The next upward phase of this cycle – once confirmed in force – would be expected to see a sharp rally, ideally taking prices back to – at minimum – the 10-day moving average. Having said that, due to the position of a larger tracked 20-day wave, there would be the potential for that rally to move on up to the higher 20-day moving average.”
As noted a week or so back, even with the larger-degree cycles seen as pointing south, Gold was looking for a sharp, short- term rally. In our Gold Wave Trader report, we noted the 2590.20 figure (December, 2024 contract) as the key upside ‘reversal point’ with price, for our 10-day wave.
With the above said and noted, once Gold took out the 2590.20 figure to the upside, that confirmed a sharp rally to be in force, one which would take Gold back to – at minimum – its 10-day moving average.
You can see this 10-day cycle on the chart below:
Having said the above, due to the position of an a larger tracked 20-day wave, I mentioned the potential for prices to rally back to the higher 20-day moving average. With the above chart, we can see that each of these moving averages have been hit on the most recent swing up, thus meeting this assumption.
In terms of patterns, due to the position of the larger 72-day (and 310-day) cycle, the ideal path favors only a countertrend rally with the smaller-degree waves. If correct, a drop back to – or below – the 2541.50 swing low would have the best technical ‘look’, and would set up the next buy with our 72-day component.
For now, it is too early to confirm a new downside reversal point for the short-term, though one should ideally materialize in the coming days, depending on the action. The exact number is always posted in our thrice-weekly Gold Wave Trader report.
The 310-Day Cycle
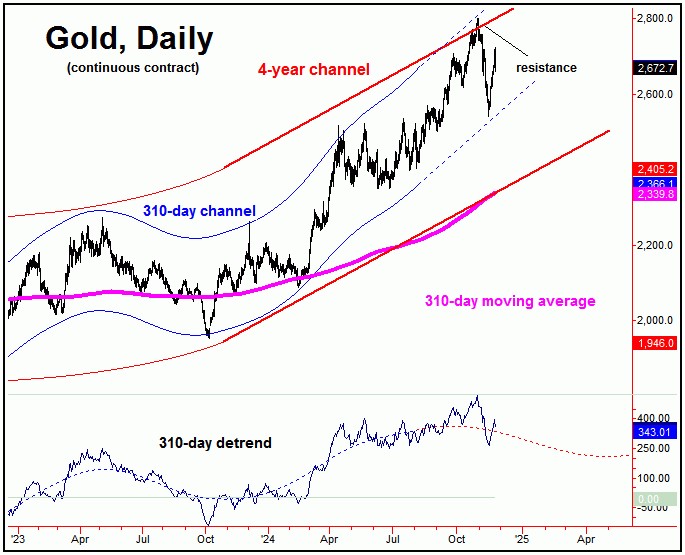
Above the 72-day wave for Gold, there is the larger 310-day cycle, which last bottomed back in October of last year – and is seen as pushing lower into next Spring:
With the above, Gold recently tested key mid-term resistance, which was the intersection point of the upper 310-day and four-year cycle channels. That resistance level was tested several times, eventually holding the bigger rally – for the sharp decline that followed.
In terms of time, the ideal path – as projected by our detrend – is looking for this wave to push down on the market, ideally holding up into the Spring of 2025 or later. Even with this, there will be the normal up-and-down gyrations in-between, some of which have been seen with the most recent action.
In terms of price, the downside ‘risk’ for the mid-term view is back to the 310-day moving average, a level which is also expected to provide key support to the bigger bull market in Gold. In terms of patterns, we are expected the decline into the next 310-day trough to end up as a larger – but countertrend – affair, before turning sharply higher again into later next year.
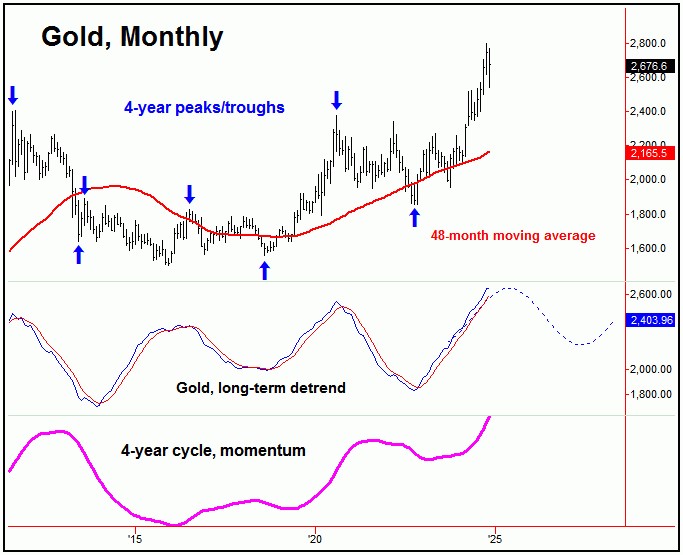
In terms of price, the next rally phase with our 310-day cycle is likely to be something in the range of 20-25% or more off of whatever bottom that forms with this wave. We expect that rally to eventually peak our largest-tracked cycle, the four-year wave, which is shown on the chart below:
For the longer-term outlook, the next major top should come from this four-year wave, ideally made on or after the late-2025 to early-2026 window. From whatever peak that forms with this component, we would expect a drop back to the 48-month moving average or lower for Gold, most likely playing out into the late-2026 to mid-2027 region; more on this as we get closer to that window.
Jim Curry
The Gold Wave Trader
Market Turns Advisory
http://goldwavetrader.com/
http://cyclewave.homestead.com/
********

