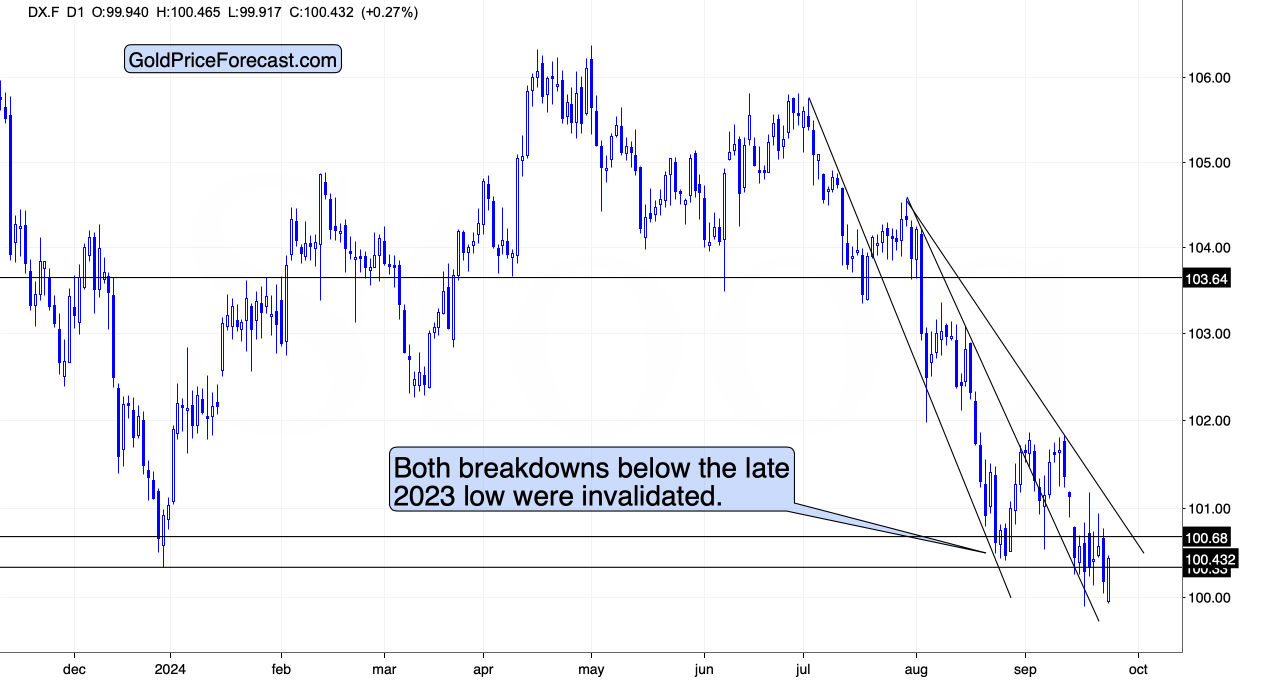
As the USD Index is testing its lows and preparing for a major rally, gold is making new highs.
But it’s likely about to end.
Fibonacci Extension: Gold Nearing Its Target
This has been one of the “the market can stay irrational longer than you can remain logical” cases, as gold has been moving higher relentlessly despite the USD Index’s broad bottom and breakout in the USD/YEN currency pair.
Markets are not logical but emotional, and by multiple means the situation is now excessive in many markets. Still, since gold was able to rally while the USD Index was trading back and forth, the question is, how high can it move while the USD Index “makes up its mind”.
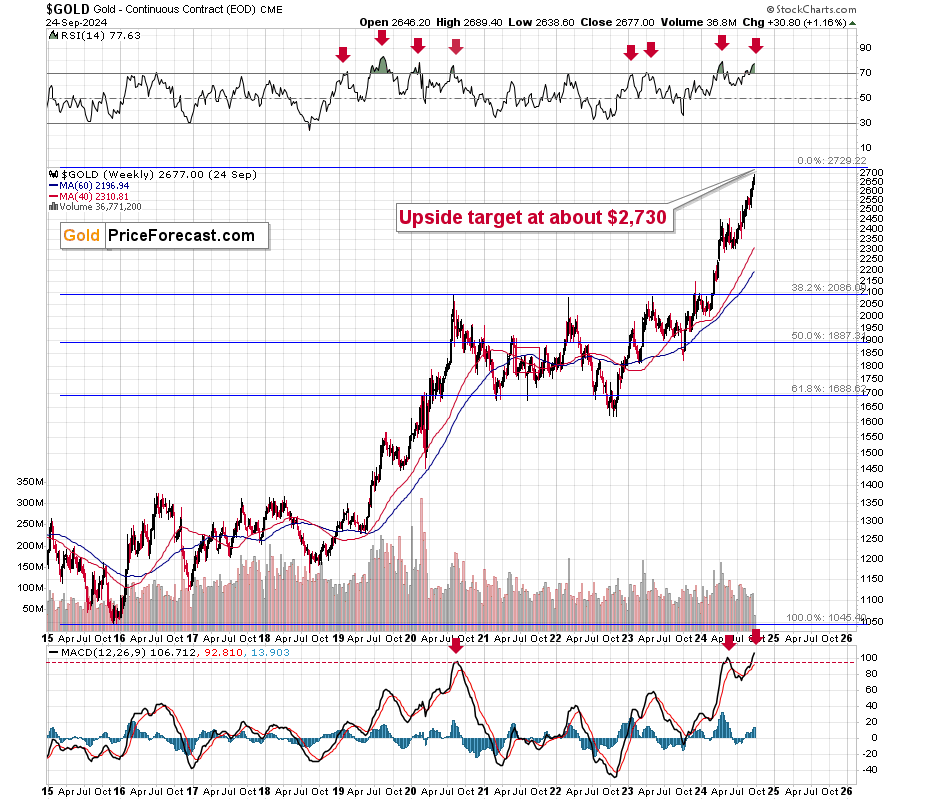
The indicators pointing to medium-term tops are mostly already “too high” indicating an extremely overbought situation. This tells us that a big decline is coming. Since they are too high, however, they don’t necessarily tell us at what price level gold is likely to turn around.
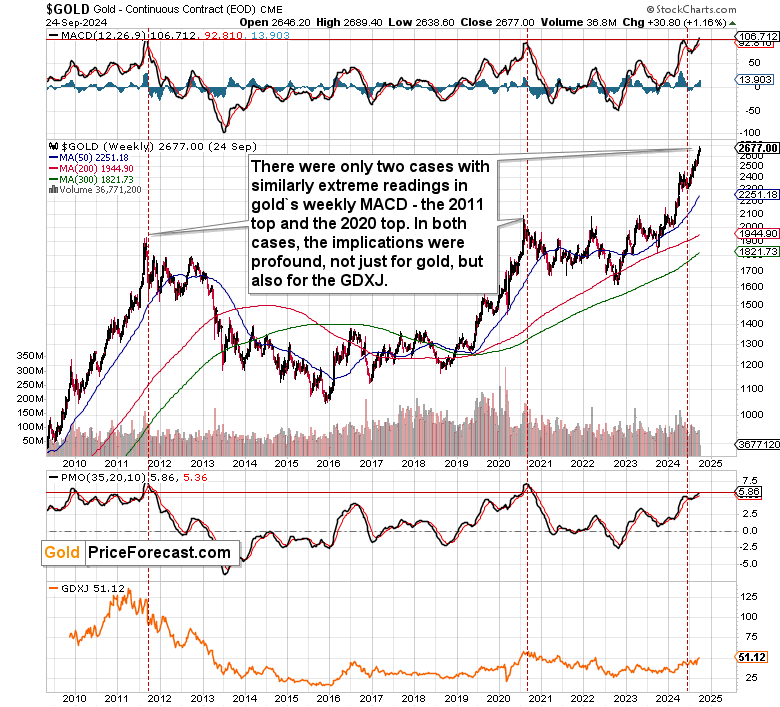
MACD visible on the above chart (its lower part) points to the situation being more excessive than any time since 2015, but it doesn’t mean that it can’t get a bit more excessive before the top is formed.
Consequently, we have to rely on other indications, and there is a particularly important one that provides insights into gold’s near-term target.
It’s the Fibonacci extension tool, which works by multiplying a previous notable rally by the 1.618 factor (the Phi number). In our case, this is gold’s 2015 – 2020 rally, and the upside target based on it is at about $2,730 (for gold futures).
Gold futures’ recent high was $2,694.75, which means that gold is just 1.3% away from its upside target – almost right at it.
RSI and MACD (and probably almost all the other indicators) already point to a top being near, and the above just shows how near it likely is.
The lower part of the chart features the PMO indicator which also points to the situation being very overbought, and it also shows what happened in junior mining stocks when both (MACD and PMO) were similarly overbought – major declines followed for months and, in fact, years.
GDXJ Reaches Strong Resistance
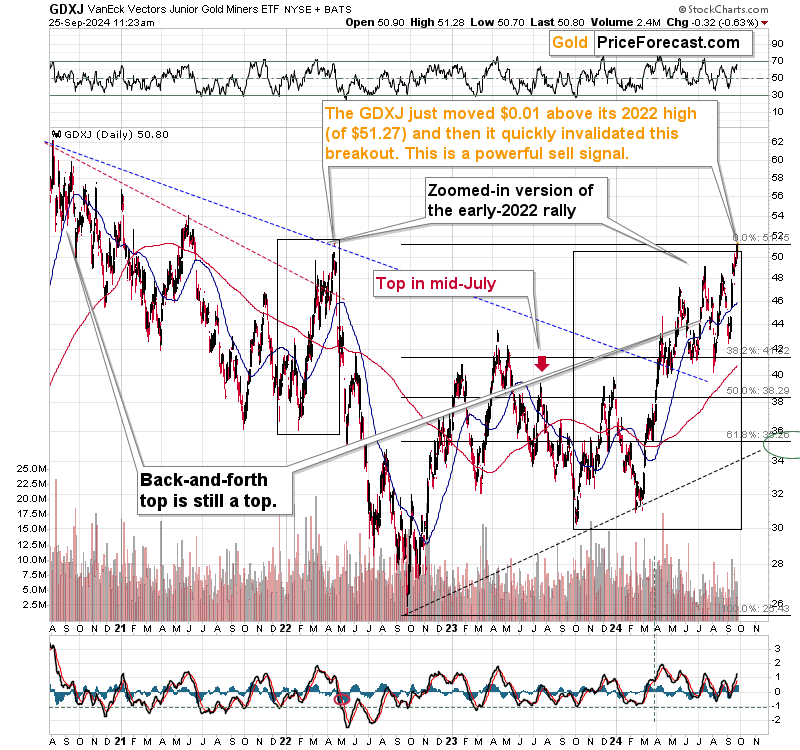
Day-traders might want to take advantage of the momentum here, but for other traders, either having or opening a short position in gold might seem more attractive. And by having or opening a short position in gold, I mean mostly opening it in junior mining stocks, which have already reached their very strong resistance in the form of the 2022 top.
The GDXJ just moved $0.01 above its 2022 high (of $51.27) and then it quickly invalidated this breakout. This is a powerful sell signal.
This is a reply to the unasked “how high is too high” question.
This, plus the proximity of gold’s upside target quite likely implies that the top in the GDXJ is in.
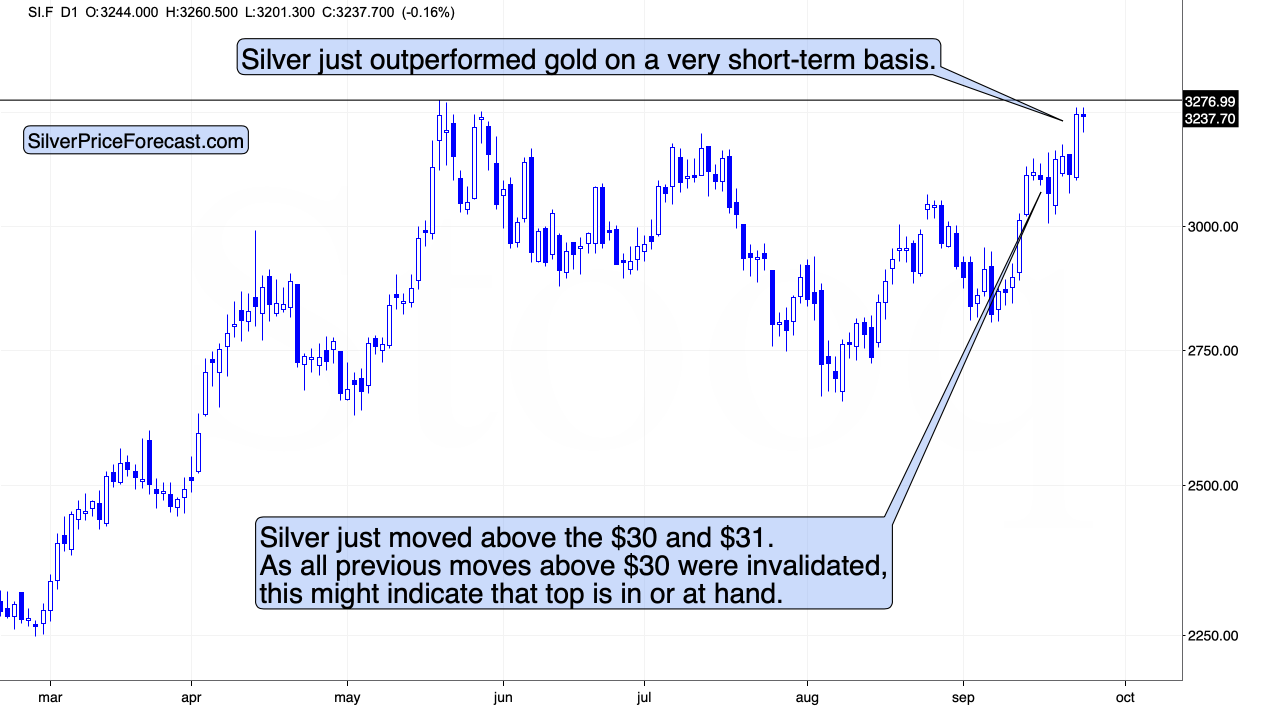
Meanwhile, silver just outperformed gold on a very short-term basis, just like it tends to before or at the top.
It seems that I should have followed by initial thought from Friday and go long silver.
Either way, with the white metal most likely either topped or will surge one last time as gold moves to its upside target. Silver’s strong resistance is just ahead – at its previous yearly high, and since silver is known for its fake breakouts, silver might top slightly above this level.
Meanwhile, the USD Index just invalidated another attempt to move below its late-2013 bottom. Is this the end of the broad bottom? Could be. If not, it’s likely just around the corner, anyway, and once the USDX finally rallies in a meaningful way, gold would be likely to decline – not in a minor way.
********

